
 Yahoo Finance
 NZ Windfarms Limited's (NZSE:NWF) Stock Has Shown Weakness Lately But Financial Prospects Look Decent: Is The Market Wrong?
With its stock down 12% over the past three months, it is easy to disregard NZ Windfarms (NZSE:NWF). However, stock prices are usually driven by a company’s financials over the long term, which in this case look pretty respectable. Specifically, we decided to study NZ Windfarms' ROE in this article.
ROE or return on equity is a useful tool to assess how effectively a company can generate returns on the investment it received from its shareholders. Simply put, it is used to assess the profitability of a company in relation to its equity capital.
View our latest analysis for NZ Windfarms
How To Calculate Return On Equity?
Return on equity can be calculated by using the formula:
Return on Equity = Net Profit (from continuing operations) ÷ Shareholders' Equity
So, based on the above formula, the ROE for NZ Windfarms is:
11% = NZ$4.4m ÷ NZ$40m (Based on the trailing twelve months to December 2021).
The 'return' is the income the business earned over the last year. So, this means that for every NZ$1 of its shareholder's investments, the company generates a profit of NZ$0.11.
What Has ROE Got To Do With Earnings Growth?
We have already established that ROE serves as an efficient profit-generating gauge for a company's future earnings. We now need to evaluate how much profit the company reinvests or "retains" for future growth which then gives us an idea about the growth potential of the company. Assuming everything else remains unchanged, the higher the ROE and profit retention, the higher the growth rate of a company compared to companies that don't necessarily bear these characteristics.
NZ Windfarms' Earnings Growth And 11% ROE
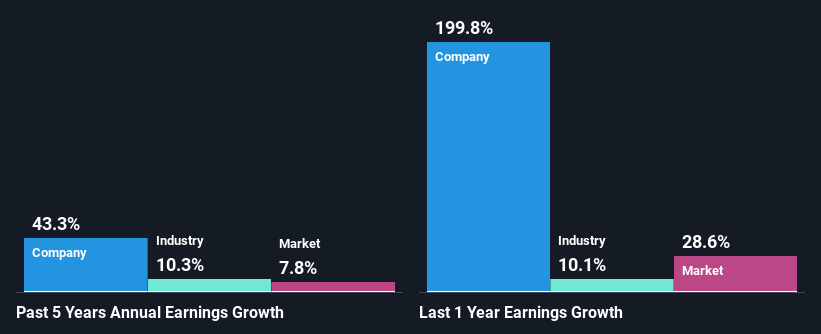
To start with, NZ Windfarms' ROE looks acceptable. Especially when compared to the industry average of 8.5% the company's ROE looks pretty impressive. Probably as a result of this, NZ Windfarms was able to see an impressive net income growth of 43% over the last five years. We believe that there might also be other aspects that are positively influencing the company's earnings growth. For instance, the company has a low payout ratio or is being managed efficiently.
We then compared NZ Windfarms' net income growth with the industry and we're pleased to see that the company's growth figure is higher when compared with the industry which has a growth rate of 10% in the same period.
The basis for attaching value to a company is, to a great extent, tied to its earnings growth. What investors need to determine next is if the expected earnings growth, or the lack of it, is already built into the share price. Doing so will help them establish if the stock's future looks promising or ominous. One good indicator of expected earnings growth is the P/E ratio which determines the price the market is willing to pay for a stock based on its earnings prospects. So, you may want to check if NZ Windfarms is trading on a high P/E or a low P/E, relative to its industry.
Is NZ Windfarms Using Its Retained Earnings Effectively?
NZ Windfarms' very high three-year median payout ratio of 300% suggests that the company is paying more to its shareholders than what it is earning. Despite this, the company's earnings grew significantly as we saw above. Having said that, the high payout ratio is definitely risky and something to keep an eye on. Our risks dashboard should have the 3 risks we have identified for NZ Windfarms.
Moreover, NZ Windfarms is determined to keep sharing its profits with shareholders which we infer from its long history of five years of paying a dividend.
Conclusion
In total, it does look like NZ Windfarms has some positive aspects to its business. Specifically, its high ROE which likely led to the growth in earnings. Bear in mind, the company reinvests little to none of its profits, which means that investors aren't necessarily reaping the full benefits of the high rate of return. So far, we've only made a quick discussion around the company's earnings growth. You can do your own research on NZ Windfarms and see how it has performed in the past by looking at this FREE detailed graph of past earnings, revenue and cash flows.
Have feedback on this article? Concerned about the content? Get in touch with us directly. Alternatively, email editorial-team (at) simplywallst.com.
This article by Simply Wall St is general in nature. We provide commentary based on historical data and analyst forecasts only using an unbiased methodology and our articles are not intended to be financial advice. It does not constitute a recommendation to buy or sell any stock, and does not take account of your objectives, or your financial situation. We aim to bring you long-term focused analysis driven by fundamental data. Note that our analysis may not factor in the latest price-sensitive company announcements or qualitative material. Simply Wall St has no position in any stocks mentioned.
