
 Yahoo Finance
 NZD/USD Forex Technical Analysis – Strengthens this Week Over .6611, Weakens Under .6575
The New Zealand Dollar closed higher last week, helped by better-than-expected consumer inflation data and a late week recovery by China’s equity markets. The strong inflation data likely weakened the case for a rate cut by the Reserve Bank of New Zealand. The currency also closed higher for a second week after confirming the previous week’s closing price reversal bottom.
At 0434 GMT, the NZD/USD settled at .6592, up 0.0001 or +0.02%.
Weekly Swing Chart Technical Analysis
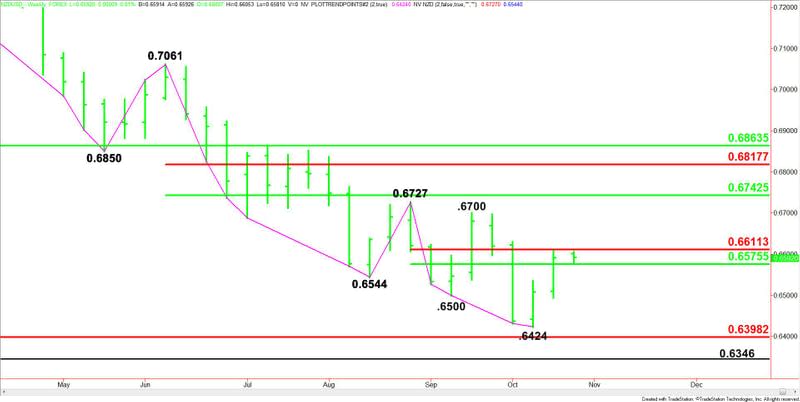
The main trend is down according to the weekly swing chart. However, momentum has been trending higher since the formation of the closing price reversal bottom at .6424 the week-ending October 12.
The main trend will change to up on a trade through .6727. A move through .6424 will negate the closing price reversal bottom and signal a resumption of the downtrend with the next targets a Fib level at .6398 and a main bottom at .6346.
The minor trend is also down. A trade through .6700 will change the minor trend to up. This will also confirm the shift in momentum to up.
The short-term range is .6727 to .6424. Its retracement zone at .6611 to .6575 is controlling the near-term direction of the Forex pair.
The main range is .7061 to .6424. If the trend changes to up then its retracement zone at .6743 to .6818 will become the primary upside target.
Weekly Swing Chart Technical Forecast
Based on last week’s close at .6591 and the upside momentum into the close, the direction of the NZD/USD this week is likely to be determined by trader reaction to the Fib level at .6611.
A sustained move under .6611 will indicate the presence of sellers. Taking out the 50% level at .6575 will indicate the selling is getting stronger. This could trigger a break into at least .6516, followed by .6424.
A sustained move over .6611 will signal the presence of buyers. This is a potential trigger point for an acceleration into the minor top at .6700, followed by the main top at .6727 and the main 50% level at .6743.
Basically, look for an upside bias to develop this week on a sustained move over .6611 and for a downside bias to develop this week on a sustained move under .6575.
This article was originally posted on FX Empire
More From FXEMPIRE:
Oil Price Fundamental Daily Forecast – Renewed Supply Worries Should Generate Upside Momentum
AUD/USD Forex Technical Analysis – October 22, 2018 Forecast
Chinese Stocks Soar on Stimulus Hopes; Italy, US-Saudi Tension and Oil Prices Remain in Focus
A Quiet Economic Calendar Leaves Geo-Politics Front and Center
