
 Yahoo Finance
 NZD/USD Forex Technical Analysis – Could Be Establishing Support Base at .6717 to .6697
The New Zealand Dollar is trading lower early Thursday in limited trading. There was no follow-through to the upside following yesterday’s higher close. The price action suggests investors are waiting for the next catalyst to give it direction. However, given this week’s holiday trade and next week’s New Year holiday, it looks as if investors are content with holding the market in a range over the near-term.
At 0434 GMT, the NZD/USD is trading .6725, down 0.0005 or -0.07%.
Yesterday’s massive stock market rally in the U.S. did very little to generate any demand for the higher-yielding New Zealand Dollar. Furthermore, investors are showing little reaction to reports that a U.S. trade team will travel to Beijing the week of January 7 to hold talks with Chinese officials.
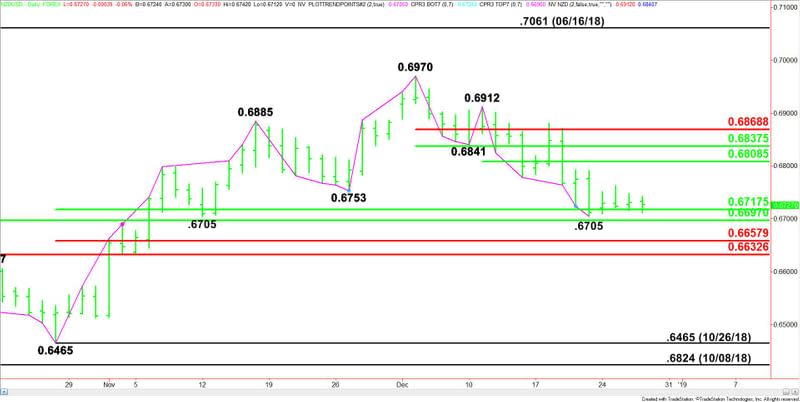
Daily Swing Chart Technical Analysis
The main trend is down according to the daily swing chart. A trade through .6705 will signal a resumption of the downtrend. The main trend will change to up on a trade through .6912, but this is not likely to occur today. However, given the prolonged move down in terms of price and time, investors should watch for a possible closing price reversal bottom.
Daily Retracement Levels Analysis
The major retracement zone is .6697 to .6633. This zone is providing support.
The main range is .6465 to .6970. Its retracement zone at .6717 to .6658 is additional support.
These two retracement zones have created support clusters at .6717 to .6697 and .6658 to .6633. The first cluster has been holding as support for five straight trading sessions. We could see similar price action on the test of the second area.
The short-term range is .6912 to .6705. Its 50% level at .6809 is resistance. A second retracement zone at .6838 to .6869 is additional resistance.
Daily Swing Chart Technical Forecast
Based on the early price action, the direction of the NZD/USD on Thursday is likely to be determined by trader reaction to the 50% level at .6717.
Bullish Scenario
A sustained move over .6717 will indicate the presence of aggressive counter-trend buyers. If this move can generate enough upside momentum then look for buyers to make a run at the short-term 50% level at .6809.
Bearish Scenario
A sustained move under .6717 will signal the presence of sellers. This could trigger a quick break into the low at .6705 then the 50% level at .6697.
Look for an acceleration to the downside if .6697 is taken out with a pair of Fibonacci levels at .6658 to .6633 the next likely downside targets.
Be patient. Big moves usually follow several days of sideways action.
This article was originally posted on FX Empire
More From FXEMPIRE:
RoboForex Introduces New Bonus and Raises Leverage Up to 1:2000
EUR/USD Price Forecast – EUR/USD Trades Zig-Zag Amid Holiday Thin Market on Dollar’s Recovery
Bitcoin – Bears Target $3,700 to bring sub-$3,000 Levels back into Play
DAX Index Daily Price Forecast – DAX to Trade Positive on Increased Risk Appetite
GBP/USD Price Forecast – GBP/USD To Trade Range Bound As Both Sides Fight For Upper Hand
