
 Yahoo Finance
 NZD/USD Forex Technical Analysis – Weekly Rally Strengthens Over .6611, Weakens Under .6576
Renewed demand for higher risk assets this week is helping to boost the New Zealand Dollar. The currency is being helped by a recovery in both China’s and the U.S. stock markets after spending most of the month under pressure as investors dumped riskier assets in favor of safe-haven assets.
At 0618 GMT, the NZD/USD is trading .6551, down 0.0004 or -0.06%. As of Tuesday’s close, the NZD/USD was up 0.0033, or 0.50% for the week.
Weekly Swing Chart Technical Analysis
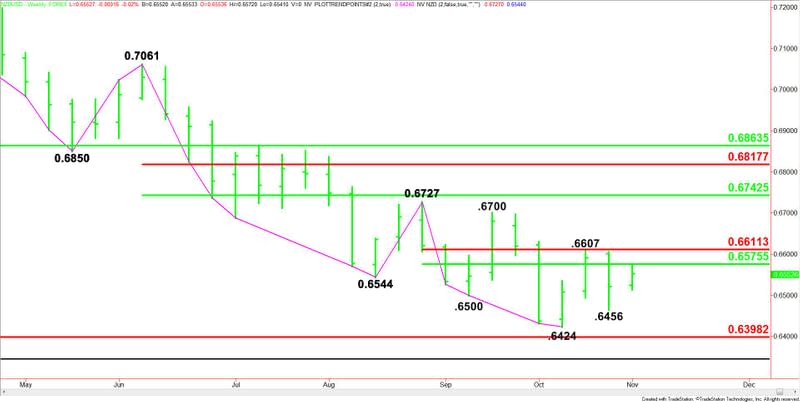
The main trend is down according to the weekly swing chart. A trade through .6424 will signal a resumption of the downtrend. A move through .6727 will change the main trend to up.
The minor trend is also down. A trade through .6607 will change the minor trend to up. This will also shift momentum to the upside.
On the downside, Fibonacci support comes in at .6398.
The short-term range is .6727 to .6424. Its retracement zone at .6576 to .6611 is the first upside target. Since the main trend is down, sellers are likely to come in on a test of this zone in an effort to form a secondary lower top. Aggressive counter-trend buyers are going to try to take out this zone.
The main range is .7061 to .6424. Its retracement zone at .6743 to .6818 is the next upside target.
Weekly Swing Chart Technical Forecast
Based on this week’s price action, the direction of the NZD/USD the rest of the week is likely to be determined by trader reaction to the 50% level at .6576.
A sustained move under .6576 will indicate the presence of sellers. If this can generate enough downside momentum then the Forex pair could turn negative for the week. If this move continues to pick up downside momentum then look for a potential challenge of .6456 and .6424.
A sustained move over .6576 will signal the presence of buyers. This could trigger a rally into .6607 then .6611. Overtaking .6611 will indicate the counter-trend buying is getting stronger. The weekly chart indicates there is no resistance until .6700 then .6727.
Basically, a downside bias could develop on a sustained move under .6576. An upside bias could develop on a sustained move over .6611.
This article was originally posted on FX Empire
