
 Yahoo Finance
 NZD/USD Forex Technical Analysis – Main Trend Up, Minor Trend Down; Trader Reaction to .6552 Sets the Tone
The New Zealand Dollar is inching higher in a lackluster trade early Friday. The move is mirroring the price action in the U.S. equity markets so we have to conclude that investor demand for risk is the early focus for investors.
A stronger U.S. Dollar weighed on the Kiwi the previous session as worries that a resurgence in the coronavirus is starting to curb economic activity drew safe-haven flows into the greenback.
At 06:55 GMT, the NZD/USD is trading .6549, up 0.0012 or +0.19%.
Earlier in the session, a survey showed manufacturing activity in New Zealand moved back to expansionary territory in June after three months of contraction, helped by an easing of coronavirus-driven lockdowns and mobility restrictions.
The Bank of New Zealand-Business NZ’s seasonally adjusted Performance of Manufacturing Index (PMI) rose to 56.3 from 39.8 in May and 26 the month before. This is the best result since April 2018.
Daily Swing Chart Technical Analysis
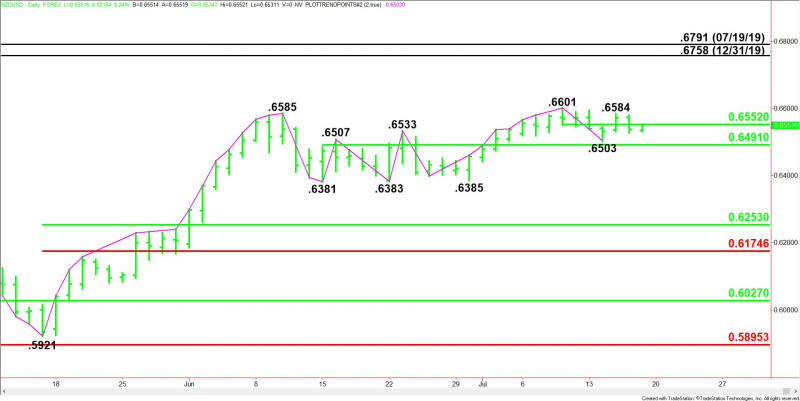
The main trend is up according to the daily swing chart, however, momentum is trending slightly lower. A trade through .6601 will signal a resumption of the uptrend. The main trend will change to down when sellers take out the series of main bottoms at .6385, .6383 and .6381.
The minor trend is down. This is controlling the momentum. A trade through .6584 will change the minor trend to up. This will shift momentum back to the upside.
The minor range is .6601 to .6503. The Forex pair has been straddling its 50% level at .6552 the last two sessions.
The short-term range is .6585 to .6381. Its 50% level at .6491 is potential support.
Daily Swing Chart Technical Forecast
The early price action suggests the direction of the NZD/USD the rest of the session on Friday is likely to be determined by trader reaction to the pivot at .6552.
Bullish Scenario
A sustained move over .6552 will indicate the presence of buyers. This could lead to a quick test of the minor top at .6584. Overcoming this level could extend the rally into the main top at .6601.
The main top at .6601 is a potential trigger point for an acceleration to the upside with the next major targets a pair of main tops from 2019 at .6758 and .6791.
Bearish Scenario
A sustained move under .6552 will signal the presence of sellers. If this creates enough downside momentum then look for the selling to possibly extend into the minor bottom at .6503, followed closely by the 50% level at .6491.
The pivot at .6491 is a potential trigger point for an acceleration to the downside. The daily chart indicates there is plenty of room to the downside with the next target zone .6385 to .6381.
For a look at all of today’s economic events, check out our economic calendar.
This article was originally posted on FX Empire
