
 Yahoo Finance
 Is Orora Limited’s (ASX:ORA) Return On Capital Employed Any Good?

Today we are going to look at Orora Limited (ASX:ORA) to see whether it might be an attractive investment prospect. To be precise, we'll consider its Return On Capital Employed (ROCE), as that will inform our view of the quality of the business.
Firstly, we'll go over how we calculate ROCE. Next, we'll compare it to others in its industry. And finally, we'll look at how its current liabilities are impacting its ROCE.
Understanding Return On Capital Employed (ROCE)
ROCE is a metric for evaluating how much pre-tax income (in percentage terms) a company earns on the capital invested in its business. Generally speaking a higher ROCE is better. In brief, it is a useful tool, but it is not without drawbacks. Author Edwin Whiting says to be careful when comparing the ROCE of different businesses, since 'No two businesses are exactly alike.
How Do You Calculate Return On Capital Employed?
The formula for calculating the return on capital employed is:
Return on Capital Employed = Earnings Before Interest and Tax (EBIT) ÷ (Total Assets - Current Liabilities)
Or for Orora:
0.094 = AU$280m ÷ (AU$4.5b - AU$1.5b) (Based on the trailing twelve months to December 2019.)
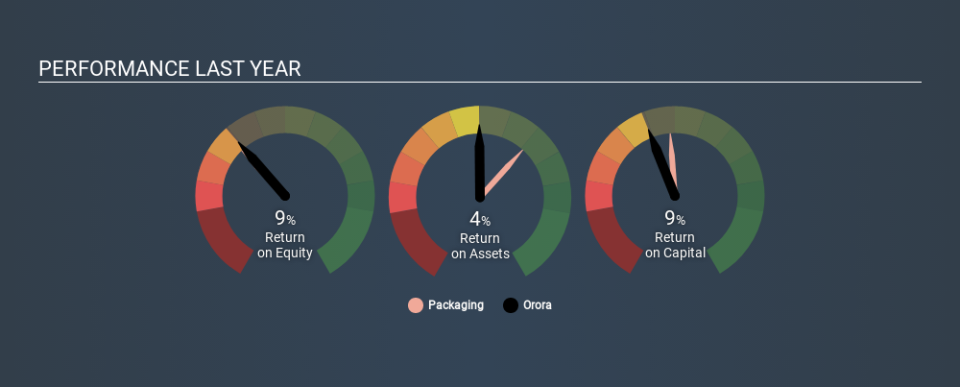
So, Orora has an ROCE of 9.4%.
See our latest analysis for Orora
Is Orora's ROCE Good?
When making comparisons between similar businesses, investors may find ROCE useful. It appears that Orora's ROCE is fairly close to the Packaging industry average of 11%. Regardless of where Orora sits next to its industry, its ROCE in absolute terms appears satisfactory, and this company could be worth a closer look.
You can click on the image below to see (in greater detail) how Orora's past growth compares to other companies.
When considering ROCE, bear in mind that it reflects the past and does not necessarily predict the future. ROCE can be deceptive for cyclical businesses, as returns can look incredible in boom times, and terribly low in downturns. ROCE is, after all, simply a snap shot of a single year. Future performance is what matters, and you can see analyst predictions in our free report on analyst forecasts for the company.
How Orora's Current Liabilities Impact Its ROCE
Current liabilities are short term bills and invoices that need to be paid in 12 months or less. Due to the way the ROCE equation works, having large bills due in the near term can make it look as though a company has less capital employed, and thus a higher ROCE than usual. To counter this, investors can check if a company has high current liabilities relative to total assets.
Orora has current liabilities of AU$1.5b and total assets of AU$4.5b. Therefore its current liabilities are equivalent to approximately 33% of its total assets. With this level of current liabilities, Orora's ROCE is boosted somewhat.
Our Take On Orora's ROCE
Orora's ROCE does look good, but the level of current liabilities also contribute to that. Orora looks strong on this analysis, but there are plenty of other companies that could be a good opportunity . Here is a free list of companies growing earnings rapidly.
If you like to buy stocks alongside management, then you might just love this free list of companies. (Hint: insiders have been buying them).
If you spot an error that warrants correction, please contact the editor at editorial-team@simplywallst.com. This article by Simply Wall St is general in nature. It does not constitute a recommendation to buy or sell any stock, and does not take account of your objectives, or your financial situation. Simply Wall St has no position in the stocks mentioned.
We aim to bring you long-term focused research analysis driven by fundamental data. Note that our analysis may not factor in the latest price-sensitive company announcements or qualitative material. Thank you for reading.
