
 Yahoo Finance
 The past year for Rightmove (LON:RMV) investors has not been profitable
Passive investing in an index fund is a good way to ensure your own returns roughly match the overall market. But if you buy individual stocks, you can do both better or worse than that. For example, the Rightmove plc (LON:RMV) share price is down 35% in the last year. That contrasts poorly with the market decline of 13%. At least the damage isn't so bad if you look at the last three years, since the stock is down 23% in that time. Furthermore, it's down 27% in about a quarter. That's not much fun for holders.
Since shareholders are down over the longer term, lets look at the underlying fundamentals over the that time and see if they've been consistent with returns.
Check out our latest analysis for Rightmove
In his essay The Superinvestors of Graham-and-Doddsville Warren Buffett described how share prices do not always rationally reflect the value of a business. One flawed but reasonable way to assess how sentiment around a company has changed is to compare the earnings per share (EPS) with the share price.
During the unfortunate twelve months during which the Rightmove share price fell, it actually saw its earnings per share (EPS) improve by 26%. It's quite possible that growth expectations may have been unreasonable in the past.
It's surprising to see the share price fall so much, despite the improved EPS. So it's easy to justify a look at some other metrics.
With a low yield of 1.8% we doubt that the dividend influences the share price much. Rightmove managed to grow revenue over the last year, which is usually a real positive. Since the fundamental metrics don't readily explain the share price drop, there might be an opportunity if the market has overreacted.
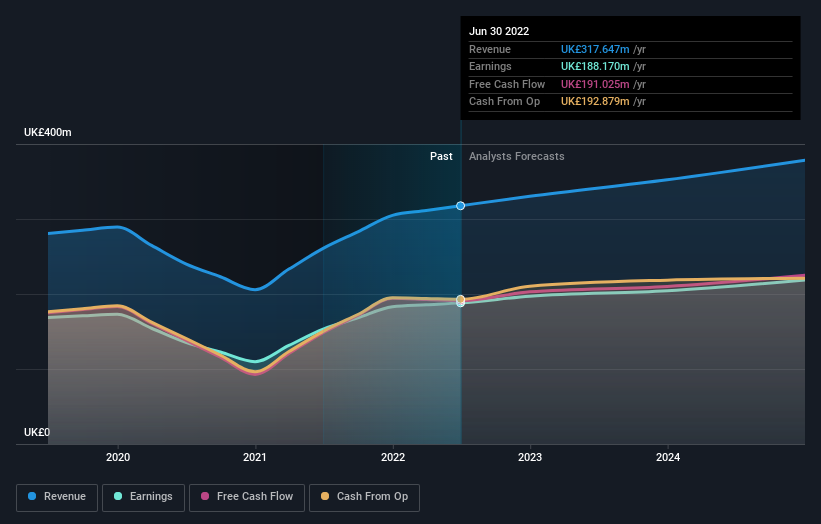
The graphic below depicts how earnings and revenue have changed over time (unveil the exact values by clicking on the image).
Rightmove is a well known stock, with plenty of analyst coverage, suggesting some visibility into future growth. You can see what analysts are predicting for Rightmove in this interactive graph of future profit estimates.
A Different Perspective
While the broader market lost about 13% in the twelve months, Rightmove shareholders did even worse, losing 34% (even including dividends). Having said that, it's inevitable that some stocks will be oversold in a falling market. The key is to keep your eyes on the fundamental developments. Longer term investors wouldn't be so upset, since they would have made 3%, each year, over five years. It could be that the recent sell-off is an opportunity, so it may be worth checking the fundamental data for signs of a long term growth trend. Before forming an opinion on Rightmove you might want to consider these 3 valuation metrics.
We will like Rightmove better if we see some big insider buys. While we wait, check out this free list of growing companies with considerable, recent, insider buying.
Please note, the market returns quoted in this article reflect the market weighted average returns of stocks that currently trade on GB exchanges.
Have feedback on this article? Concerned about the content? Get in touch with us directly. Alternatively, email editorial-team (at) simplywallst.com.
This article by Simply Wall St is general in nature. We provide commentary based on historical data and analyst forecasts only using an unbiased methodology and our articles are not intended to be financial advice. It does not constitute a recommendation to buy or sell any stock, and does not take account of your objectives, or your financial situation. We aim to bring you long-term focused analysis driven by fundamental data. Note that our analysis may not factor in the latest price-sensitive company announcements or qualitative material. Simply Wall St has no position in any stocks mentioned.
Join A Paid User Research Session
You’ll receive a US$30 Amazon Gift card for 1 hour of your time while helping us build better investing tools for the individual investors like yourself. Sign up here
