
 Yahoo Finance
 The past year for Saratoga Investment (NYSE:SAR) investors has not been profitable
Most people feel a little frustrated if a stock they own goes down in price. But often it is not a reflection of the fundamental business performance. So while the Saratoga Investment Corp. (NYSE:SAR) share price is down 13% in the last year, the total return to shareholders (which includes dividends) was -6.6%. That's better than the market which declined 15% over the last year. At least the damage isn't so bad if you look at the last three years, since the stock is down 7.5% in that time.
It's worthwhile assessing if the company's economics have been moving in lockstep with these underwhelming shareholder returns, or if there is some disparity between the two. So let's do just that.
Check out our latest analysis for Saratoga Investment
There is no denying that markets are sometimes efficient, but prices do not always reflect underlying business performance. One way to examine how market sentiment has changed over time is to look at the interaction between a company's share price and its earnings per share (EPS).
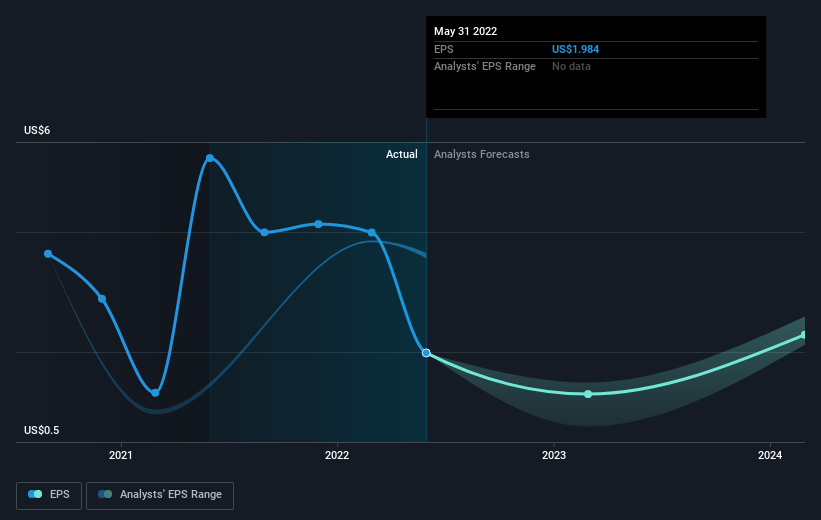
Unfortunately Saratoga Investment reported an EPS drop of 62% for the last year. This fall in the EPS is significantly worse than the 13% the share price fall. It may have been that the weak EPS was not as bad as some had feared.
The graphic below depicts how EPS has changed over time (unveil the exact values by clicking on the image).
Before buying or selling a stock, we always recommend a close examination of historic growth trends, available here.
What About Dividends?
It is important to consider the total shareholder return, as well as the share price return, for any given stock. Whereas the share price return only reflects the change in the share price, the TSR includes the value of dividends (assuming they were reinvested) and the benefit of any discounted capital raising or spin-off. It's fair to say that the TSR gives a more complete picture for stocks that pay a dividend. In the case of Saratoga Investment, it has a TSR of -6.6% for the last 1 year. That exceeds its share price return that we previously mentioned. The dividends paid by the company have thusly boosted the total shareholder return.
A Different Perspective
While it's certainly disappointing to see that Saratoga Investment shares lost 6.6% throughout the year, that wasn't as bad as the market loss of 15%. Longer term investors wouldn't be so upset, since they would have made 11%, each year, over five years. It could be that the business is just facing some short term problems, but shareholders should keep a close eye on the fundamentals. While it is well worth considering the different impacts that market conditions can have on the share price, there are other factors that are even more important. Consider for instance, the ever-present spectre of investment risk. We've identified 5 warning signs with Saratoga Investment (at least 3 which make us uncomfortable) , and understanding them should be part of your investment process.
We will like Saratoga Investment better if we see some big insider buys. While we wait, check out this free list of growing companies with considerable, recent, insider buying.
Please note, the market returns quoted in this article reflect the market weighted average returns of stocks that currently trade on US exchanges.
Have feedback on this article? Concerned about the content? Get in touch with us directly. Alternatively, email editorial-team (at) simplywallst.com.
This article by Simply Wall St is general in nature. We provide commentary based on historical data and analyst forecasts only using an unbiased methodology and our articles are not intended to be financial advice. It does not constitute a recommendation to buy or sell any stock, and does not take account of your objectives, or your financial situation. We aim to bring you long-term focused analysis driven by fundamental data. Note that our analysis may not factor in the latest price-sensitive company announcements or qualitative material. Simply Wall St has no position in any stocks mentioned.
Join A Paid User Research Session
You’ll receive a US$30 Amazon Gift card for 1 hour of your time while helping us build better investing tools for the individual investors like yourself. Sign up here
