
 Yahoo Finance
 The past three years for Ryman Healthcare (NZSE:RYM) investors has not been profitable
Investing in stocks inevitably means buying into some companies that perform poorly. But the last three years have been particularly tough on longer term Ryman Healthcare Limited (NZSE:RYM) shareholders. Regrettably, they have had to cope with a 65% drop in the share price over that period. Furthermore, it's down 18% in about a quarter. That's not much fun for holders. This could be related to the recent financial results - you can catch up on the most recent data by reading our company report.
It's worthwhile assessing if the company's economics have been moving in lockstep with these underwhelming shareholder returns, or if there is some disparity between the two. So let's do just that.
Check out our latest analysis for Ryman Healthcare
There is no denying that markets are sometimes efficient, but prices do not always reflect underlying business performance. One imperfect but simple way to consider how the market perception of a company has shifted is to compare the change in the earnings per share (EPS) with the share price movement.
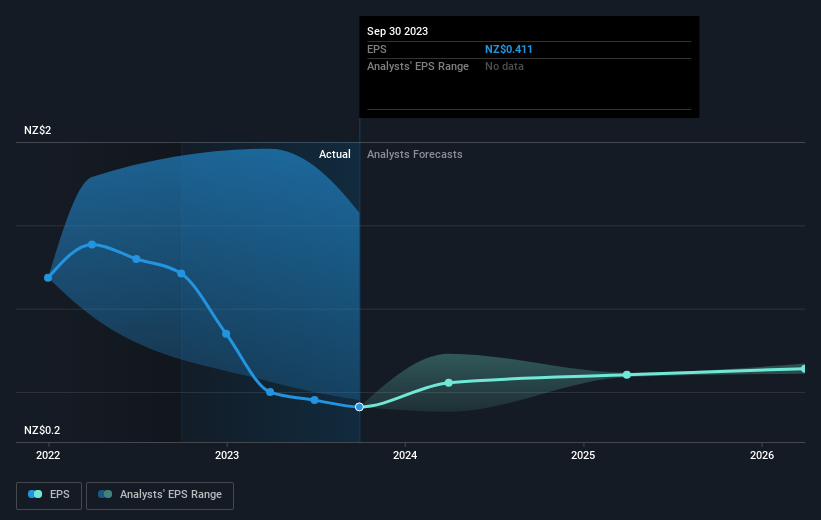
During the three years that the share price fell, Ryman Healthcare's earnings per share (EPS) dropped by 14% each year. The share price decline of 29% is actually steeper than the EPS slippage. So it's likely that the EPS decline has disappointed the market, leaving investors hesitant to buy.
You can see how EPS has changed over time in the image below (click on the chart to see the exact values).
We like that insiders have been buying shares in the last twelve months. Having said that, most people consider earnings and revenue growth trends to be a more meaningful guide to the business. It might be well worthwhile taking a look at our free report on Ryman Healthcare's earnings, revenue and cash flow.
What About The Total Shareholder Return (TSR)?
We'd be remiss not to mention the difference between Ryman Healthcare's total shareholder return (TSR) and its share price return. Arguably the TSR is a more complete return calculation because it accounts for the value of dividends (as if they were reinvested), along with the hypothetical value of any discounted capital that have been offered to shareholders. Its history of dividend payouts mean that Ryman Healthcare's TSR, which was a 59% drop over the last 3 years, was not as bad as the share price return.
A Different Perspective
We're pleased to report that Ryman Healthcare shareholders have received a total shareholder return of 2.2% over one year. There's no doubt those recent returns are much better than the TSR loss of 7% per year over five years. This makes us a little wary, but the business might have turned around its fortunes. It's always interesting to track share price performance over the longer term. But to understand Ryman Healthcare better, we need to consider many other factors. To that end, you should learn about the 4 warning signs we've spotted with Ryman Healthcare (including 1 which is concerning) .
If you like to buy stocks alongside management, then you might just love this free list of companies. (Hint: insiders have been buying them).
Please note, the market returns quoted in this article reflect the market weighted average returns of stocks that currently trade on New Zealander exchanges.
Have feedback on this article? Concerned about the content? Get in touch with us directly. Alternatively, email editorial-team (at) simplywallst.com.
This article by Simply Wall St is general in nature. We provide commentary based on historical data and analyst forecasts only using an unbiased methodology and our articles are not intended to be financial advice. It does not constitute a recommendation to buy or sell any stock, and does not take account of your objectives, or your financial situation. We aim to bring you long-term focused analysis driven by fundamental data. Note that our analysis may not factor in the latest price-sensitive company announcements or qualitative material. Simply Wall St has no position in any stocks mentioned.
