
 Yahoo Finance
 Paychex (NASDAQ:PAYX) Is Reinvesting To Multiply In Value
What trends should we look for it we want to identify stocks that can multiply in value over the long term? In a perfect world, we'd like to see a company investing more capital into its business and ideally the returns earned from that capital are also increasing. If you see this, it typically means it's a company with a great business model and plenty of profitable reinvestment opportunities. Ergo, when we looked at the ROCE trends at Paychex (NASDAQ:PAYX), we liked what we saw.
Return On Capital Employed (ROCE): What Is It?
If you haven't worked with ROCE before, it measures the 'return' (pre-tax profit) a company generates from capital employed in its business. Analysts use this formula to calculate it for Paychex:
Return on Capital Employed = Earnings Before Interest and Tax (EBIT) ÷ (Total Assets - Current Liabilities)
0.43 = US$2.1b ÷ (US$12b - US$7.3b) (Based on the trailing twelve months to August 2023).
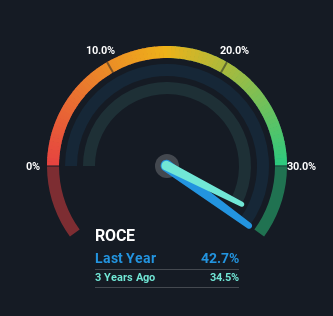
Thus, Paychex has an ROCE of 43%. That's a fantastic return and not only that, it outpaces the average of 12% earned by companies in a similar industry.
Check out our latest analysis for Paychex
In the above chart we have measured Paychex's prior ROCE against its prior performance, but the future is arguably more important. If you're interested, you can view the analysts predictions in our free report on analyst forecasts for the company.
So How Is Paychex's ROCE Trending?
It's hard not to be impressed by Paychex's returns on capital. The company has consistently earned 43% for the last five years, and the capital employed within the business has risen 83% in that time. Returns like this are the envy of most businesses and given it has repeatedly reinvested at these rates, that's even better. If these trends can continue, it wouldn't surprise us if the company became a multi-bagger.
Another thing to note, Paychex has a high ratio of current liabilities to total assets of 60%. This can bring about some risks because the company is basically operating with a rather large reliance on its suppliers or other sorts of short-term creditors. Ideally we'd like to see this reduce as that would mean fewer obligations bearing risks.
What We Can Learn From Paychex's ROCE
Paychex has demonstrated its proficiency by generating high returns on increasing amounts of capital employed, which we're thrilled about. And since the stock has risen strongly over the last five years, it appears the market might expect this trend to continue. So while the positive underlying trends may be accounted for by investors, we still think this stock is worth looking into further.
Like most companies, Paychex does come with some risks, and we've found 1 warning sign that you should be aware of.
Paychex is not the only stock earning high returns. If you'd like to see more, check out our free list of companies earning high returns on equity with solid fundamentals.
Have feedback on this article? Concerned about the content? Get in touch with us directly. Alternatively, email editorial-team (at) simplywallst.com.
This article by Simply Wall St is general in nature. We provide commentary based on historical data and analyst forecasts only using an unbiased methodology and our articles are not intended to be financial advice. It does not constitute a recommendation to buy or sell any stock, and does not take account of your objectives, or your financial situation. We aim to bring you long-term focused analysis driven by fundamental data. Note that our analysis may not factor in the latest price-sensitive company announcements or qualitative material. Simply Wall St has no position in any stocks mentioned.
