
 Yahoo Finance
 Perion Network (NASDAQ:PERI) Is Doing The Right Things To Multiply Its Share Price
Finding a business that has the potential to grow substantially is not easy, but it is possible if we look at a few key financial metrics. Ideally, a business will show two trends; firstly a growing return on capital employed (ROCE) and secondly, an increasing amount of capital employed. This shows us that it's a compounding machine, able to continually reinvest its earnings back into the business and generate higher returns. With that in mind, we've noticed some promising trends at Perion Network (NASDAQ:PERI) so let's look a bit deeper.
Understanding Return On Capital Employed (ROCE)
If you haven't worked with ROCE before, it measures the 'return' (pre-tax profit) a company generates from capital employed in its business. Analysts use this formula to calculate it for Perion Network:
Return on Capital Employed = Earnings Before Interest and Tax (EBIT) ÷ (Total Assets - Current Liabilities)
0.13 = US$72m ÷ (US$712m - US$166m) (Based on the trailing twelve months to June 2022).
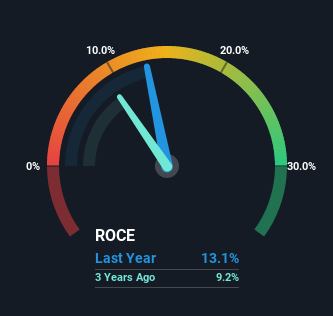
Therefore, Perion Network has an ROCE of 13%. In absolute terms, that's a satisfactory return, but compared to the Media industry average of 7.5% it's much better.
See our latest analysis for Perion Network
Above you can see how the current ROCE for Perion Network compares to its prior returns on capital, but there's only so much you can tell from the past. If you'd like, you can check out the forecasts from the analysts covering Perion Network here for free.
How Are Returns Trending?
We like the trends that we're seeing from Perion Network. The numbers show that in the last five years, the returns generated on capital employed have grown considerably to 13%. The amount of capital employed has increased too, by 138%. So we're very much inspired by what we're seeing at Perion Network thanks to its ability to profitably reinvest capital.
Our Take On Perion Network's ROCE
In summary, it's great to see that Perion Network can compound returns by consistently reinvesting capital at increasing rates of return, because these are some of the key ingredients of those highly sought after multi-baggers. And a remarkable 446% total return over the last five years tells us that investors are expecting more good things to come in the future. So given the stock has proven it has promising trends, it's worth researching the company further to see if these trends are likely to persist.
One more thing, we've spotted 1 warning sign facing Perion Network that you might find interesting.
While Perion Network isn't earning the highest return, check out this free list of companies that are earning high returns on equity with solid balance sheets.
Have feedback on this article? Concerned about the content? Get in touch with us directly. Alternatively, email editorial-team (at) simplywallst.com.
This article by Simply Wall St is general in nature. We provide commentary based on historical data and analyst forecasts only using an unbiased methodology and our articles are not intended to be financial advice. It does not constitute a recommendation to buy or sell any stock, and does not take account of your objectives, or your financial situation. We aim to bring you long-term focused analysis driven by fundamental data. Note that our analysis may not factor in the latest price-sensitive company announcements or qualitative material. Simply Wall St has no position in any stocks mentioned.
Join A Paid User Research Session
You’ll receive a US$30 Amazon Gift card for 1 hour of your time while helping us build better investing tools for the individual investors like yourself. Sign up here
