
 Yahoo Finance
 Poh Kong Holdings Berhad (KLSE:POHKONG) shareholders have earned a 20% CAGR over the last three years
By buying an index fund, investors can approximate the average market return. But if you pick the right individual stocks, you could make more than that. For example, Poh Kong Holdings Berhad (KLSE:POHKONG) shareholders have seen the share price rise 64% over three years, well in excess of the market decline (3.8%, not including dividends). On the other hand, the returns haven't been quite so good recently, with shareholders up just 4.8% , including dividends .
With that in mind, it's worth seeing if the company's underlying fundamentals have been the driver of long term performance, or if there are some discrepancies.
View our latest analysis for Poh Kong Holdings Berhad
There is no denying that markets are sometimes efficient, but prices do not always reflect underlying business performance. One flawed but reasonable way to assess how sentiment around a company has changed is to compare the earnings per share (EPS) with the share price.
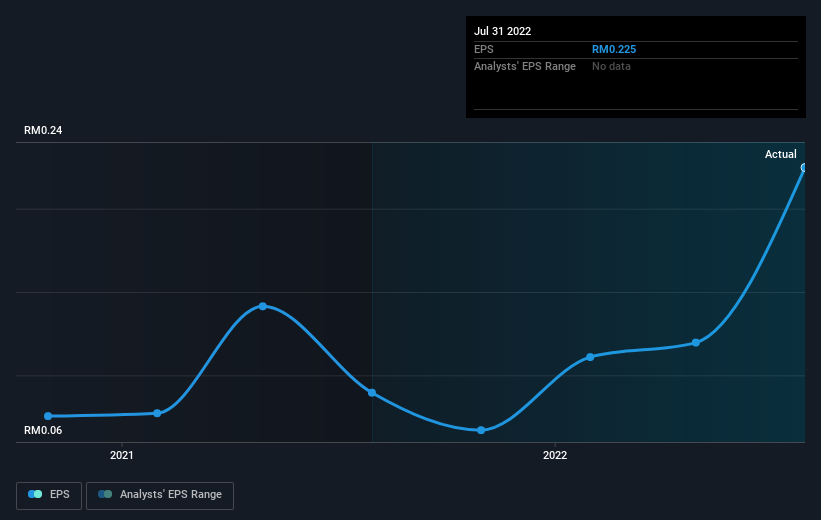
Poh Kong Holdings Berhad was able to grow its EPS at 54% per year over three years, sending the share price higher. This EPS growth is higher than the 18% average annual increase in the share price. So one could reasonably conclude that the market has cooled on the stock. This cautious sentiment is reflected in its (fairly low) P/E ratio of 3.54.
The image below shows how EPS has tracked over time (if you click on the image you can see greater detail).
Before buying or selling a stock, we always recommend a close examination of historic growth trends, available here.
What About Dividends?
As well as measuring the share price return, investors should also consider the total shareholder return (TSR). The TSR incorporates the value of any spin-offs or discounted capital raisings, along with any dividends, based on the assumption that the dividends are reinvested. So for companies that pay a generous dividend, the TSR is often a lot higher than the share price return. In the case of Poh Kong Holdings Berhad, it has a TSR of 75% for the last 3 years. That exceeds its share price return that we previously mentioned. This is largely a result of its dividend payments!
A Different Perspective
It's good to see that Poh Kong Holdings Berhad has rewarded shareholders with a total shareholder return of 4.8% in the last twelve months. Of course, that includes the dividend. However, that falls short of the 7% TSR per annum it has made for shareholders, each year, over five years. Potential buyers might understandably feel they've missed the opportunity, but it's always possible business is still firing on all cylinders. I find it very interesting to look at share price over the long term as a proxy for business performance. But to truly gain insight, we need to consider other information, too. Case in point: We've spotted 2 warning signs for Poh Kong Holdings Berhad you should be aware of.
Of course Poh Kong Holdings Berhad may not be the best stock to buy. So you may wish to see this free collection of growth stocks.
Please note, the market returns quoted in this article reflect the market weighted average returns of stocks that currently trade on MY exchanges.
Have feedback on this article? Concerned about the content? Get in touch with us directly. Alternatively, email editorial-team (at) simplywallst.com.
This article by Simply Wall St is general in nature. We provide commentary based on historical data and analyst forecasts only using an unbiased methodology and our articles are not intended to be financial advice. It does not constitute a recommendation to buy or sell any stock, and does not take account of your objectives, or your financial situation. We aim to bring you long-term focused analysis driven by fundamental data. Note that our analysis may not factor in the latest price-sensitive company announcements or qualitative material. Simply Wall St has no position in any stocks mentioned.
Join A Paid User Research Session
You’ll receive a US$30 Amazon Gift card for 1 hour of your time while helping us build better investing tools for the individual investors like yourself. Sign up here
