
 Yahoo Finance
 Here’s What Port of Tauranga Limited’s (NZSE:POT) P/E Is Telling Us

Want to participate in a short research study? Help shape the future of investing tools and you could win a $250 gift card!
This article is written for those who want to get better at using price to earnings ratios (P/E ratios). To keep it practical, we’ll show how Port of Tauranga Limited’s (NZSE:POT) P/E ratio could help you assess the value on offer. Based on the last twelve months, Port of Tauranga’s P/E ratio is 36.82. That corresponds to an earnings yield of approximately 2.7%.
See our latest analysis for Port of Tauranga
How Do You Calculate A P/E Ratio?
The formula for price to earnings is:
Price to Earnings Ratio = Price per Share ÷ Earnings per Share (EPS)
Or for Port of Tauranga:
P/E of 36.82 = NZ$5.17 ÷ NZ$0.14 (Based on the trailing twelve months to June 2018.)
Is A High P/E Ratio Good?
A higher P/E ratio implies that investors pay a higher price for the earning power of the business. That isn’t necessarily good or bad, but a high P/E implies relatively high expectations of what a company can achieve in the future.
How Growth Rates Impact P/E Ratios
Probably the most important factor in determining what P/E a company trades on is the earnings growth. That’s because companies that grow earnings per share quickly will rapidly increase the ‘E’ in the equation. That means unless the share price increases, the P/E will reduce in a few years. So while a stock may look expensive based on past earnings, it could be cheap based on future earnings.
It’s great to see that Port of Tauranga grew EPS by 13% in the last year. And its annual EPS growth rate over 3 years is 7.4%. With that performance, you might expect an above average P/E ratio.
How Does Port of Tauranga’s P/E Ratio Compare To Its Peers?
The P/E ratio indicates whether the market has higher or lower expectations of a company. You can see in the image below that the average P/E (22.2) for companies in the infrastructure industry is lower than Port of Tauranga’s P/E.
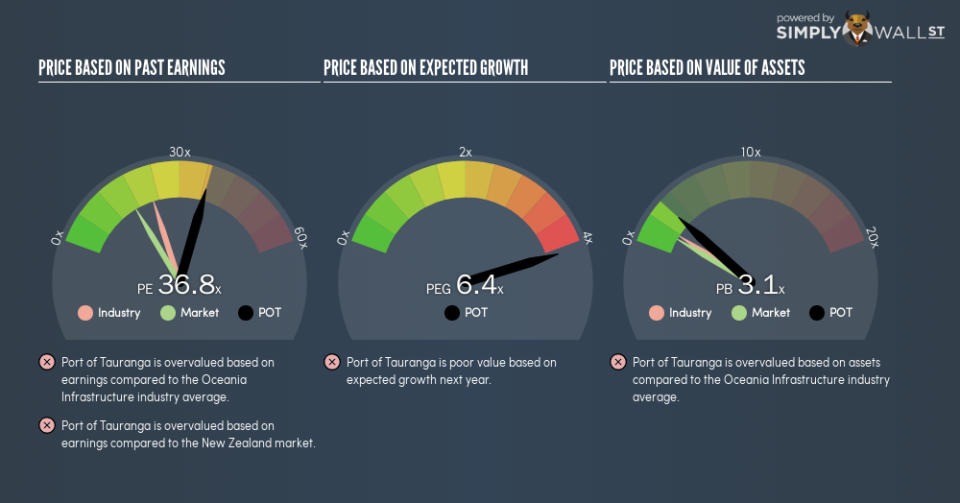
Port of Tauranga’s P/E tells us that market participants think the company will perform better than its industry peers, going forward. The market is optimistic about the future, but that doesn’t guarantee future growth. So investors should delve deeper. I like to check if company insiders have been buying or selling.
Don’t Forget: The P/E Does Not Account For Debt or Bank Deposits
Don’t forget that the P/E ratio considers market capitalization. In other words, it does not consider any debt or cash that the company may have on the balance sheet. Theoretically, a business can improve its earnings (and produce a lower P/E in the future), by taking on debt (or spending its remaining cash).
Such spending might be good or bad, overall, but the key point here is that you need to look at debt to understand the P/E ratio in context.
Port of Tauranga’s Balance Sheet
Port of Tauranga has net debt worth 12% of its market capitalization. This could bring some additional risk, and reduce the number of investment options for management; worth remembering if you compare its P/E to businesses without debt.
The Verdict On Port of Tauranga’s P/E Ratio
Port of Tauranga trades on a P/E ratio of 36.8, which is above the NZ market average of 16.8. Its debt levels do not imperil its balance sheet and it has already proven it can grow. So it does not seem strange that the P/E is above average.
When the market is wrong about a stock, it gives savvy investors an opportunity. If the reality for a company is better than it expects, you can make money by buying and holding for the long term. So this free report on the analyst consensus forecasts could help you make a master move on this stock.
You might be able to find a better buy than Port of Tauranga. If you want a selection of possible winners, check out this free list of interesting companies that trade on a P/E below 20 (but have proven they can grow earnings).
To help readers see past the short term volatility of the financial market, we aim to bring you a long-term focused research analysis purely driven by fundamental data. Note that our analysis does not factor in the latest price-sensitive company announcements.
The author is an independent contributor and at the time of publication had no position in the stocks mentioned. For errors that warrant correction please contact the editor at editorial-team@simplywallst.com.
