
 Yahoo Finance
 Price & Volume: The Anatomy of a True Market Leader
Price & Volume are Key Elements
Studies show that as much as 60% of the human body is comprised of hydrogen and oxygen (water). Said another way, without water, humans cannot survive very long. In the stock market, the elements that comprise a true market leader are strong price and volume trends. Without these two critical ingredients, a stock is unlikely to trend higher.
Monitoring price and volume (or supply and demand) is vital for an investor because it can provide valuable insights into the behavior of the general market and individual equities, such as clues of:
· Institutional Accumulation: When a stock shoots higher on expanding price and volume, it can be a clue that an institution is accumulating a position. For example, after its last earnings report, Nvidia (NVDA) gapped higher by 14% on volume 129% above the norm.
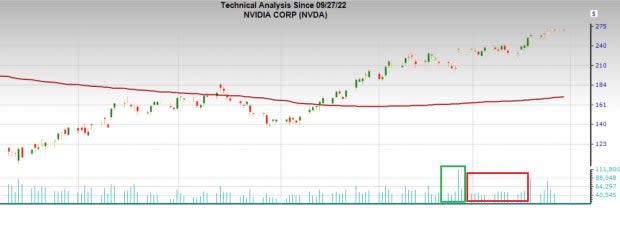
Image Source: Zacks Investment Research
Nvidia traded a mind-blowing 111 million shares in the session. Because such a large number of shares is impossible for retail investors to buy, the demand was indicative of institutional investors like mutual funds, banks, and pension funds. Remember, institutions move stocks, not retail.
· A Strong Pullback: As any experienced investor knows, no stock goes straight up. For this reason, investors can gain valuable information by monitoring how a stock pulls back. Shallow pullbacks on low volume are a sign of digestion, not downward conviction. Often, the strength of a stock is revealed in the pullback, not the advance. See Advanced Micro Devices (AMD) below:
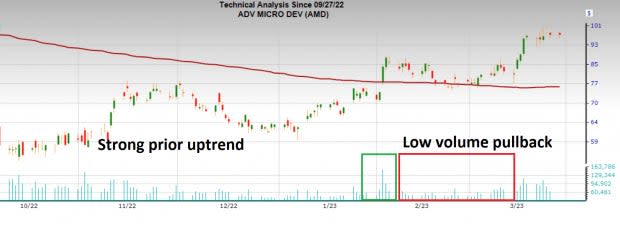
Image Source: Zacks Investment Research
· Weak Rallies: When a stock moves higher on low volume, it should raise cautionary flags for investors. Rallies like this signify that while the stock is moving higher, conviction is low. A good recent example is Walker Dunlop (WD).

Image Source: Zacks Investment Research
Takeaway
Similar to how a doctor consoles an X-Ray for pertinent information, investors look to price and volume charts to reveal important patterns. Charts help investors to identify institutional accumulation from low conviction accumulation. Furthermore, they allow investors to separate strong pullbacks from weak ones. As the old saying goes, “a picture is worth a thousand words.”
Want the latest recommendations from Zacks Investment Research? Today, you can download 7 Best Stocks for the Next 30 Days. Click to get this free report
Advanced Micro Devices, Inc. (AMD) : Free Stock Analysis Report
NVIDIA Corporation (NVDA) : Free Stock Analysis Report
Walker & Dunlop, Inc. (WD) : Free Stock Analysis Report
