
 Yahoo Finance
 Provident Financial Holdings (NASDAQ:PROV) shareholders have endured a 29% loss from investing in the stock three years ago
Many investors define successful investing as beating the market average over the long term. But its virtually certain that sometimes you will buy stocks that fall short of the market average returns. We regret to report that long term Provident Financial Holdings, Inc. (NASDAQ:PROV) shareholders have had that experience, with the share price dropping 36% in three years, versus a market return of about 22%.
Since shareholders are down over the longer term, lets look at the underlying fundamentals over the that time and see if they've been consistent with returns.
View our latest analysis for Provident Financial Holdings
While markets are a powerful pricing mechanism, share prices reflect investor sentiment, not just underlying business performance. One imperfect but simple way to consider how the market perception of a company has shifted is to compare the change in the earnings per share (EPS) with the share price movement.
Although the share price is down over three years, Provident Financial Holdings actually managed to grow EPS by 20% per year in that time. This is quite a puzzle, and suggests there might be something temporarily buoying the share price. Or else the company was over-hyped in the past, and so its growth has disappointed.
It's worth taking a look at other metrics, because the EPS growth doesn't seem to match with the falling share price.
We note that the dividend seems healthy enough, so that probably doesn't explain the share price drop. However, the weak share price might be related to the fact revenue has been disappearing at a rate of 6.0% each year, over three years. This could have some investors worried about the longer term growth potential (or lack thereof).
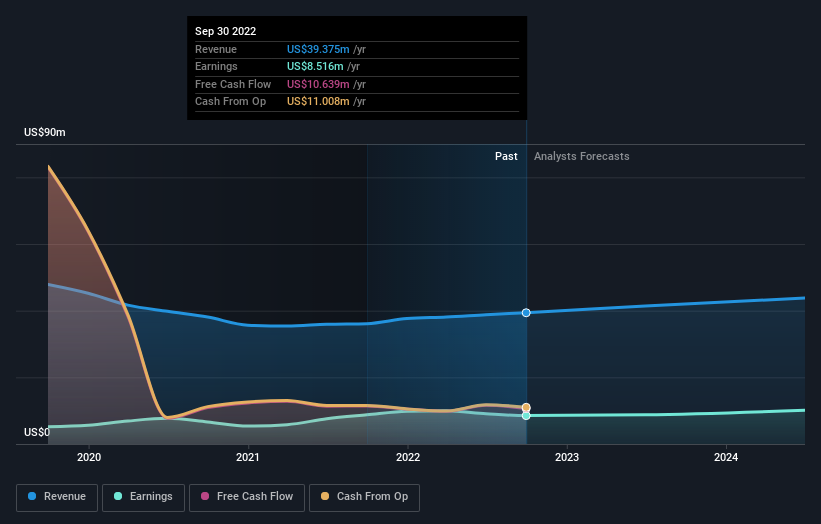
The company's revenue and earnings (over time) are depicted in the image below (click to see the exact numbers).
You can see how its balance sheet has strengthened (or weakened) over time in this free interactive graphic.
What About Dividends?
When looking at investment returns, it is important to consider the difference between total shareholder return (TSR) and share price return. Whereas the share price return only reflects the change in the share price, the TSR includes the value of dividends (assuming they were reinvested) and the benefit of any discounted capital raising or spin-off. Arguably, the TSR gives a more comprehensive picture of the return generated by a stock. In the case of Provident Financial Holdings, it has a TSR of -29% for the last 3 years. That exceeds its share price return that we previously mentioned. And there's no prize for guessing that the dividend payments largely explain the divergence!
A Different Perspective
Although it hurts that Provident Financial Holdings returned a loss of 13% in the last twelve months, the broader market was actually worse, returning a loss of 20%. Given the total loss of 2% per year over five years, it seems returns have deteriorated in the last twelve months. While some investors do well specializing in buying companies that are struggling (but nonetheless undervalued), don't forget that Buffett said that 'turnarounds seldom turn'. Keeping this in mind, a solid next step might be to take a look at Provident Financial Holdings' dividend track record. This free interactive graph is a great place to start.
But note: Provident Financial Holdings may not be the best stock to buy. So take a peek at this free list of interesting companies with past earnings growth (and further growth forecast).
Please note, the market returns quoted in this article reflect the market weighted average returns of stocks that currently trade on US exchanges.
Have feedback on this article? Concerned about the content? Get in touch with us directly. Alternatively, email editorial-team (at) simplywallst.com.
This article by Simply Wall St is general in nature. We provide commentary based on historical data and analyst forecasts only using an unbiased methodology and our articles are not intended to be financial advice. It does not constitute a recommendation to buy or sell any stock, and does not take account of your objectives, or your financial situation. We aim to bring you long-term focused analysis driven by fundamental data. Note that our analysis may not factor in the latest price-sensitive company announcements or qualitative material. Simply Wall St has no position in any stocks mentioned.
Join A Paid User Research Session
You’ll receive a US$30 Amazon Gift card for 1 hour of your time while helping us build better investing tools for the individual investors like yourself. Sign up here
