
 Yahoo Finance
 Quartix Technologies (LON:QTX) investors are sitting on a loss of 27% if they invested a year ago
Passive investing in an index fund is a good way to ensure your own returns roughly match the overall market. Active investors aim to buy stocks that vastly outperform the market - but in the process, they risk under-performance. For example, the Quartix Technologies Plc (LON:QTX) share price is down 29% in the last year. That falls noticeably short of the market decline of around 0.1%. The silver lining (for longer term investors) is that the stock is still 29% higher than it was three years ago. Shareholders have had an even rougher run lately, with the share price down 10% in the last 90 days. But this could be related to the weak market, which is down 5.0% in the same period.
So let's have a look and see if the longer term performance of the company has been in line with the underlying business' progress.
Check out our latest analysis for Quartix Technologies
While the efficient markets hypothesis continues to be taught by some, it has been proven that markets are over-reactive dynamic systems, and investors are not always rational. By comparing earnings per share (EPS) and share price changes over time, we can get a feel for how investor attitudes to a company have morphed over time.
During the unfortunate twelve months during which the Quartix Technologies share price fell, it actually saw its earnings per share (EPS) improve by 2.9%. Of course, the situation might betray previous over-optimism about growth.
By glancing at these numbers, we'd posit that the the market had expectations of much higher growth, last year. But looking to other metrics might better explain the share price change.
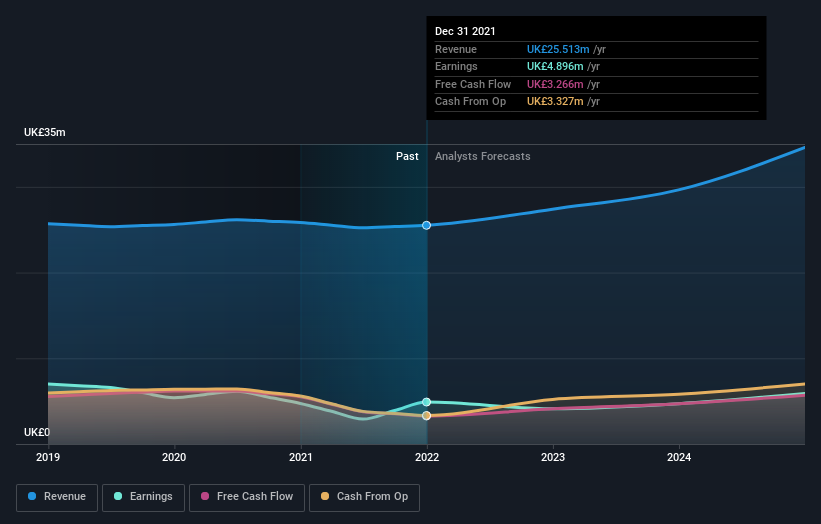
Revenue was pretty flat on last year, which isn't too bad. However, it is certainly possible the market was expecting an uptick in revenue, and that the share price fall reflects that disappointment.
The company's revenue and earnings (over time) are depicted in the image below (click to see the exact numbers).
Balance sheet strength is crucial. It might be well worthwhile taking a look at our free report on how its financial position has changed over time.
A Different Perspective
While the broader market lost about 0.1% in the twelve months, Quartix Technologies shareholders did even worse, losing 27% (even including dividends). However, it could simply be that the share price has been impacted by broader market jitters. It might be worth keeping an eye on the fundamentals, in case there's a good opportunity. On the bright side, long term shareholders have made money, with a gain of 0.3% per year over half a decade. It could be that the recent sell-off is an opportunity, so it may be worth checking the fundamental data for signs of a long term growth trend. It's always interesting to track share price performance over the longer term. But to understand Quartix Technologies better, we need to consider many other factors. Even so, be aware that Quartix Technologies is showing 2 warning signs in our investment analysis , you should know about...
Of course Quartix Technologies may not be the best stock to buy. So you may wish to see this free collection of growth stocks.
Please note, the market returns quoted in this article reflect the market weighted average returns of stocks that currently trade on GB exchanges.
Have feedback on this article? Concerned about the content? Get in touch with us directly. Alternatively, email editorial-team (at) simplywallst.com.
This article by Simply Wall St is general in nature. We provide commentary based on historical data and analyst forecasts only using an unbiased methodology and our articles are not intended to be financial advice. It does not constitute a recommendation to buy or sell any stock, and does not take account of your objectives, or your financial situation. We aim to bring you long-term focused analysis driven by fundamental data. Note that our analysis may not factor in the latest price-sensitive company announcements or qualitative material. Simply Wall St has no position in any stocks mentioned.
