
 Yahoo Finance
 Ramsay Health Care Ltd's Dividend Analysis
Understanding Ramsay Health Care Ltd's Dividend Dynamics
Ramsay Health Care Ltd (RMYHY) recently announced a dividend of $0.07 per share, payable on 2024-04-22, with the ex-dividend date set for 2024-03-11. As investors look forward to this upcoming payment, the spotlight also shines on the company's dividend history, yield, and growth rates. Using the data from GuruFocus, let's look into Ramsay Health Care Ltd's dividend performance and assess its sustainability.
What Does Ramsay Health Care Ltd Do?
This Powerful Chart Made Peter Lynch 29% A Year For 13 Years
How to calculate the intrinsic value of a stock?
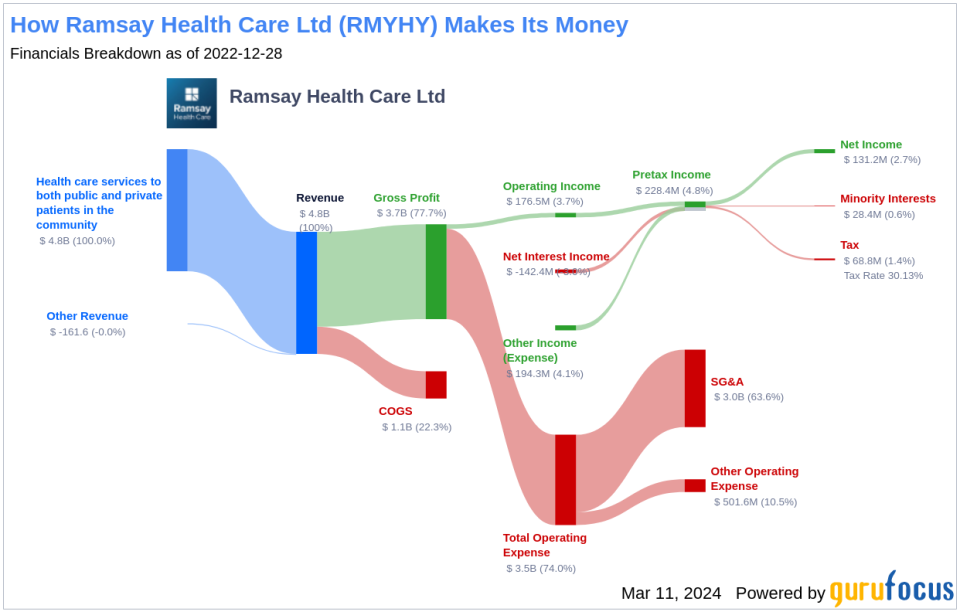
Ramsay Health Care is one of the largest private healthcare providers in the world, with over 460 facilities across 10 countries. The key markets in which it operates are Australia, France, the UK, and Sweden. It is the largest private hospital group in each of these markets except for the UK where it ranks fifth. Ramsay Sante, which operates the European regions other than the UK, is a 52.5%-owned subsidiary of Ramsay Health Care. The company typically earns about 60% of consolidated earnings in Australia and 30% in France. Ramsay Health Care undertakes both private and publicly funded healthcare.
A Glimpse at Ramsay Health Care Ltd's Dividend History
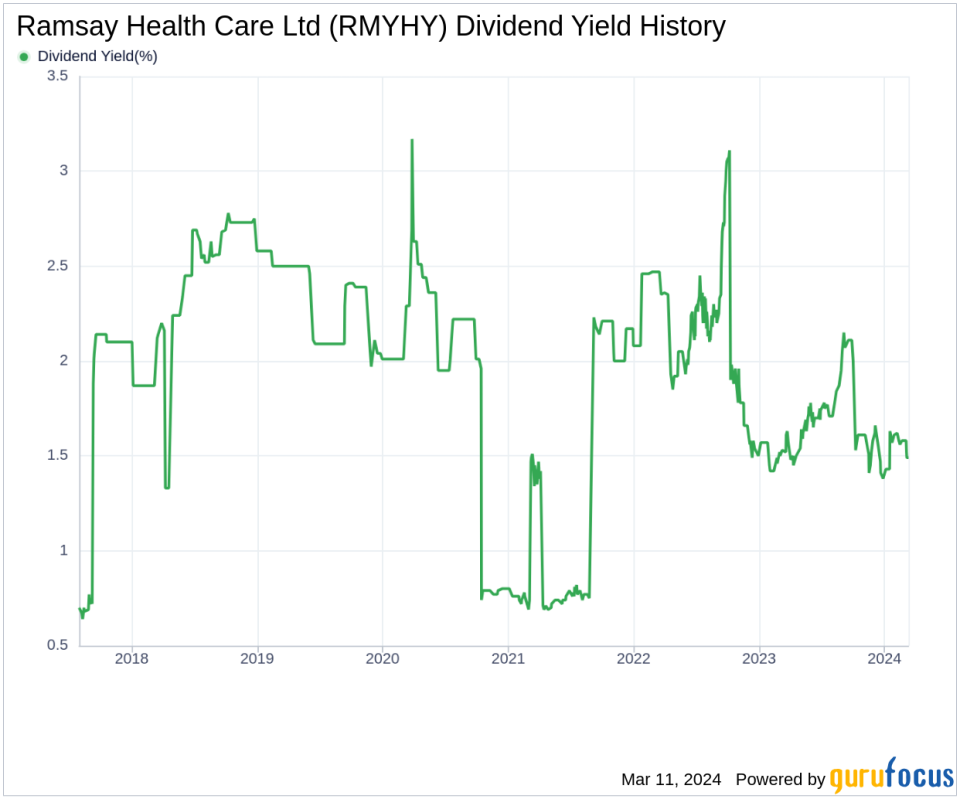
Ramsay Health Care Ltd has maintained a consistent dividend payment record since 2016. Dividends are currently distributed on a bi-annually basis. Below is a chart showing annual Dividends Per Share for tracking historical trends.
Breaking Down Ramsay Health Care Ltd's Dividend Yield and Growth
As of today, Ramsay Health Care Ltd currently has a 12-month trailing dividend yield of 1.49% and a 12-month forward dividend yield of 1.26%. This suggests an expectation of decreased dividend payments over the next 12 months.
Over the past three years, Ramsay Health Care Ltd's annual dividend growth rate was -13.80%. Extended to a five-year horizon, this rate increased to -7.60% per year. And over the past decade, Ramsay Health Care Ltd's annual dividends per share growth rate stands at 3.70%.
Based on Ramsay Health Care Ltd's dividend yield and five-year growth rate, the 5-year yield on cost of Ramsay Health Care Ltd stock as of today is approximately 1.00%.
The Sustainability Question: Payout Ratio and Profitability
To assess the sustainability of the dividend, one needs to evaluate the company's payout ratio. The dividend payout ratio provides insights into the portion of earnings the company distributes as dividends. A lower ratio suggests that the company retains a significant part of its earnings, thereby ensuring the availability of funds for future growth and unexpected downturns. As of 2023-12-31, Ramsay Health Care Ltd's dividend payout ratio is 0.82, which may suggest that the company's dividend may not be sustainable.
Ramsay Health Care Ltd's profitability rank, offers an understanding of the company's earnings prowess relative to its peers. GuruFocus ranks Ramsay Health Care Ltd's profitability 8 out of 10 as of 2023-12-31, suggesting good profitability prospects. The company has reported positive net income for each year over the past decade, further solidifying its high profitability.
Growth Metrics: The Future Outlook
To ensure the sustainability of dividends, a company must have robust growth metrics. Ramsay Health Care Ltd's growth rank of 8 out of 10 suggests that the company's growth trajectory is good relative to its competitors.
Revenue is the lifeblood of any company, and Ramsay Health Care Ltd's revenue per share, combined with the 3-year revenue growth rate, indicates a strong revenue model. Ramsay Health Care Ltd's revenue has increased by approximately 4.30% per year on average, a rate that underperforms approximately 66.49% of global competitors.
The company's 3-year EPS growth rate showcases its capability to grow its earnings, a critical component for sustaining dividends in the long run. During the past three years, Ramsay Health Care Ltd's earnings increased by approximately -8.40% per year on average, a rate that underperforms approximately 71.94% of global competitors.
Lastly, the company's 5-year EBITDA growth rate of -12.80%, which underperforms approximately 86.78% of global competitors.
Next Steps
Considering Ramsay Health Care Ltd's dividend payments, dividend growth rate, payout ratio, profitability, and growth metrics, investors should weigh the current yield against these factors to determine the long-term viability of their investment. While the payout ratio and recent dividend cuts raise questions about sustainability, the company's strong profitability and growth ranks indicate potential for future stability and growth. Investors must also consider industry trends, regulatory changes, and Ramsay Health Care Ltd's strategic initiatives when making their decisions. For those seeking additional high-dividend yield opportunities, GuruFocus Premium users can utilize the High Dividend Yield Screener to discover more options.
This article, generated by GuruFocus, is designed to provide general insights and is not tailored financial advice. Our commentary is rooted in historical data and analyst projections, utilizing an impartial methodology, and is not intended to serve as specific investment guidance. It does not formulate a recommendation to purchase or divest any stock and does not consider individual investment objectives or financial circumstances. Our objective is to deliver long-term, fundamental data-driven analysis. Be aware that our analysis might not incorporate the most recent, price-sensitive company announcements or qualitative information. GuruFocus holds no position in the stocks mentioned herein.
This article first appeared on GuruFocus.
