
 Yahoo Finance
 Ready Capital (NYSE:RC) stock performs better than its underlying earnings growth over last five years
Ready Capital Corporation (NYSE:RC) shareholders should be happy to see the share price up 28% in the last month. But if you look at the last five years the returns have not been good. After all, the share price is down 15% in that time, significantly under-performing the market.
On a more encouraging note the company has added US$87m to its market cap in just the last 7 days, so let's see if we can determine what's driven the five-year loss for shareholders.
View our latest analysis for Ready Capital
While the efficient markets hypothesis continues to be taught by some, it has been proven that markets are over-reactive dynamic systems, and investors are not always rational. One imperfect but simple way to consider how the market perception of a company has shifted is to compare the change in the earnings per share (EPS) with the share price movement.
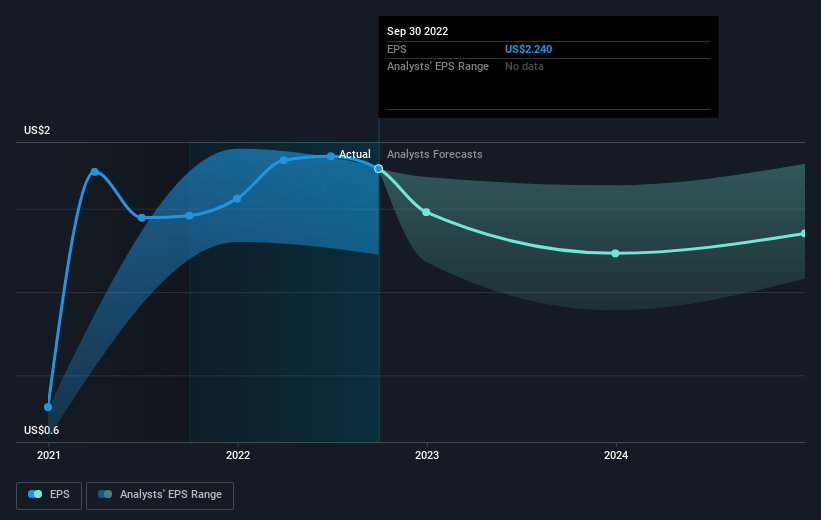
While the share price declined over five years, Ready Capital actually managed to increase EPS by an average of 1.2% per year. Given the share price reaction, one might suspect that EPS is not a good guide to the business performance during the period (perhaps due to a one-off loss or gain). Alternatively, growth expectations may have been unreasonable in the past.
Given EPS is up and the share price is down, it's clear the market is more concerned about the business than it was previously. Generally speaking, though, if the company can keep growing EPS then the share price will eventually follow.
You can see below how EPS has changed over time (discover the exact values by clicking on the image).
We know that Ready Capital has improved its bottom line lately, but is it going to grow revenue? This free report showing analyst revenue forecasts should help you figure out if the EPS growth can be sustained.
What About Dividends?
It is important to consider the total shareholder return, as well as the share price return, for any given stock. The TSR incorporates the value of any spin-offs or discounted capital raisings, along with any dividends, based on the assumption that the dividends are reinvested. So for companies that pay a generous dividend, the TSR is often a lot higher than the share price return. We note that for Ready Capital the TSR over the last 5 years was 51%, which is better than the share price return mentioned above. And there's no prize for guessing that the dividend payments largely explain the divergence!
A Different Perspective
While it's certainly disappointing to see that Ready Capital shares lost 3.5% throughout the year, that wasn't as bad as the market loss of 20%. Longer term investors wouldn't be so upset, since they would have made 9%, each year, over five years. It could be that the business is just facing some short term problems, but shareholders should keep a close eye on the fundamentals. It's always interesting to track share price performance over the longer term. But to understand Ready Capital better, we need to consider many other factors. Even so, be aware that Ready Capital is showing 5 warning signs in our investment analysis , and 2 of those are significant...
Of course, you might find a fantastic investment by looking elsewhere. So take a peek at this free list of companies we expect will grow earnings.
Please note, the market returns quoted in this article reflect the market weighted average returns of stocks that currently trade on US exchanges.
Have feedback on this article? Concerned about the content? Get in touch with us directly. Alternatively, email editorial-team (at) simplywallst.com.
This article by Simply Wall St is general in nature. We provide commentary based on historical data and analyst forecasts only using an unbiased methodology and our articles are not intended to be financial advice. It does not constitute a recommendation to buy or sell any stock, and does not take account of your objectives, or your financial situation. We aim to bring you long-term focused analysis driven by fundamental data. Note that our analysis may not factor in the latest price-sensitive company announcements or qualitative material. Simply Wall St has no position in any stocks mentioned.
Join A Paid User Research Session
You’ll receive a US$30 Amazon Gift card for 1 hour of your time while helping us build better investing tools for the individual investors like yourself. Sign up here
