
 Yahoo Finance
 Can Rent-A-Center, Inc. (NASDAQ:RCII) Improve Its Returns?
One of the best investments we can make is in our own knowledge and skill set. With that in mind, this article will work through how we can use Return On Equity (ROE) to better understand a business. By way of learning-by-doing, we'll look at ROE to gain a better understanding of Rent-A-Center, Inc. (NASDAQ:RCII).
Return on equity or ROE is a key measure used to assess how efficiently a company's management is utilizing the company's capital. In short, ROE shows the profit each dollar generates with respect to its shareholder investments.
Check out our latest analysis for Rent-A-Center
How Do You Calculate Return On Equity?
ROE can be calculated by using the formula:
Return on Equity = Net Profit (from continuing operations) ÷ Shareholders' Equity
So, based on the above formula, the ROE for Rent-A-Center is:
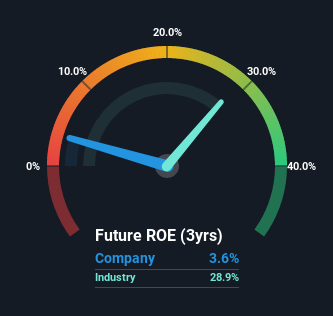
3.6% = US$20m ÷ US$548m (Based on the trailing twelve months to September 2022).
The 'return' is the amount earned after tax over the last twelve months. That means that for every $1 worth of shareholders' equity, the company generated $0.04 in profit.
Does Rent-A-Center Have A Good ROE?
One simple way to determine if a company has a good return on equity is to compare it to the average for its industry. However, this method is only useful as a rough check, because companies do differ quite a bit within the same industry classification. As is clear from the image below, Rent-A-Center has a lower ROE than the average (29%) in the Specialty Retail industry.
That certainly isn't ideal. That being said, a low ROE is not always a bad thing, especially if the company has low leverage as this still leaves room for improvement if the company were to take on more debt. A high debt company having a low ROE is a different story altogether and a risky investment in our books. To know the 4 risks we have identified for Rent-A-Center visit our risks dashboard for free.
How Does Debt Impact ROE?
Most companies need money -- from somewhere -- to grow their profits. That cash can come from issuing shares, retained earnings, or debt. In the case of the first and second options, the ROE will reflect this use of cash, for growth. In the latter case, the use of debt will improve the returns, but will not change the equity. In this manner the use of debt will boost ROE, even though the core economics of the business stay the same.
Combining Rent-A-Center's Debt And Its 3.6% Return On Equity
Rent-A-Center clearly uses a high amount of debt to boost returns, as it has a debt to equity ratio of 2.50. The combination of a rather low ROE and significant use of debt is not particularly appealing. Investors should think carefully about how a company might perform if it was unable to borrow so easily, because credit markets do change over time.
Summary
Return on equity is useful for comparing the quality of different businesses. Companies that can achieve high returns on equity without too much debt are generally of good quality. If two companies have around the same level of debt to equity, and one has a higher ROE, I'd generally prefer the one with higher ROE.
But ROE is just one piece of a bigger puzzle, since high quality businesses often trade on high multiples of earnings. The rate at which profits are likely to grow, relative to the expectations of profit growth reflected in the current price, must be considered, too. So you might want to take a peek at this data-rich interactive graph of forecasts for the company.
Of course, you might find a fantastic investment by looking elsewhere. So take a peek at this free list of interesting companies.
Have feedback on this article? Concerned about the content? Get in touch with us directly. Alternatively, email editorial-team (at) simplywallst.com.
This article by Simply Wall St is general in nature. We provide commentary based on historical data and analyst forecasts only using an unbiased methodology and our articles are not intended to be financial advice. It does not constitute a recommendation to buy or sell any stock, and does not take account of your objectives, or your financial situation. We aim to bring you long-term focused analysis driven by fundamental data. Note that our analysis may not factor in the latest price-sensitive company announcements or qualitative material. Simply Wall St has no position in any stocks mentioned.
Join A Paid User Research Session
You’ll receive a US$30 Amazon Gift card for 1 hour of your time while helping us build better investing tools for the individual investors like yourself. Sign up here
