
 Yahoo Finance
 Retail Food Group (ASX:RFG) Could Be Struggling To Allocate Capital
What financial metrics can indicate to us that a company is maturing or even in decline? Typically, we'll see the trend of both return on capital employed (ROCE) declining and this usually coincides with a decreasing amount of capital employed. This reveals that the company isn't compounding shareholder wealth because returns are falling and its net asset base is shrinking. So after glancing at the trends within Retail Food Group (ASX:RFG), we weren't too hopeful.
Return On Capital Employed (ROCE): What Is It?
If you haven't worked with ROCE before, it measures the 'return' (pre-tax profit) a company generates from capital employed in its business. Analysts use this formula to calculate it for Retail Food Group:
Return on Capital Employed = Earnings Before Interest and Tax (EBIT) ÷ (Total Assets - Current Liabilities)
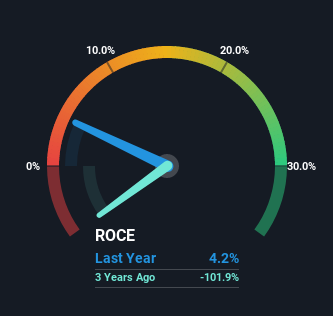
0.042 = AU$12m ÷ (AU$350m - AU$71m) (Based on the trailing twelve months to July 2022).
Therefore, Retail Food Group has an ROCE of 4.2%. Ultimately, that's a low return and it under-performs the Hospitality industry average of 7.9%.
View our latest analysis for Retail Food Group
Above you can see how the current ROCE for Retail Food Group compares to its prior returns on capital, but there's only so much you can tell from the past. If you're interested, you can view the analysts predictions in our free report on analyst forecasts for the company.
What Does the ROCE Trend For Retail Food Group Tell Us?
We are a bit anxious about the trends of ROCE at Retail Food Group. To be more specific, today's ROCE was 11% five years ago but has since fallen to 4.2%. What's equally concerning is that the amount of capital deployed in the business has shrunk by 67% over that same period. The combination of lower ROCE and less capital employed can indicate that a business is likely to be facing some competitive headwinds or seeing an erosion to its moat. Typically businesses that exhibit these characteristics aren't the ones that tend to multiply over the long term, because statistically speaking, they've already gone through the growth phase of their life cycle.
While on the subject, we noticed that the ratio of current liabilities to total assets has risen to 20%, which has impacted the ROCE. Without this increase, it's likely that ROCE would be even lower than 4.2%. While the ratio isn't currently too high, it's worth keeping an eye on this because if it gets particularly high, the business could then face some new elements of risk.
What We Can Learn From Retail Food Group's ROCE
In short, lower returns and decreasing amounts capital employed in the business doesn't fill us with confidence. We expect this has contributed to the stock plummeting 99% during the last five years. With underlying trends that aren't great in these areas, we'd consider looking elsewhere.
Retail Food Group does have some risks though, and we've spotted 3 warning signs for Retail Food Group that you might be interested in.
For those who like to invest in solid companies, check out this free list of companies with solid balance sheets and high returns on equity.
Have feedback on this article? Concerned about the content? Get in touch with us directly. Alternatively, email editorial-team (at) simplywallst.com.
This article by Simply Wall St is general in nature. We provide commentary based on historical data and analyst forecasts only using an unbiased methodology and our articles are not intended to be financial advice. It does not constitute a recommendation to buy or sell any stock, and does not take account of your objectives, or your financial situation. We aim to bring you long-term focused analysis driven by fundamental data. Note that our analysis may not factor in the latest price-sensitive company announcements or qualitative material. Simply Wall St has no position in any stocks mentioned.
Join A Paid User Research Session
You’ll receive a US$30 Amazon Gift card for 1 hour of your time while helping us build better investing tools for the individual investors like yourself. Sign up here
