
 Yahoo Finance
 The Return Trends At Foley Wines (NZSE:FWL) Look Promising
There are a few key trends to look for if we want to identify the next multi-bagger. One common approach is to try and find a company with returns on capital employed (ROCE) that are increasing, in conjunction with a growing amount of capital employed. Put simply, these types of businesses are compounding machines, meaning they are continually reinvesting their earnings at ever-higher rates of return. With that in mind, we've noticed some promising trends at Foley Wines (NZSE:FWL) so let's look a bit deeper.
What Is Return On Capital Employed (ROCE)?
If you haven't worked with ROCE before, it measures the 'return' (pre-tax profit) a company generates from capital employed in its business. The formula for this calculation on Foley Wines is:
Return on Capital Employed = Earnings Before Interest and Tax (EBIT) ÷ (Total Assets - Current Liabilities)
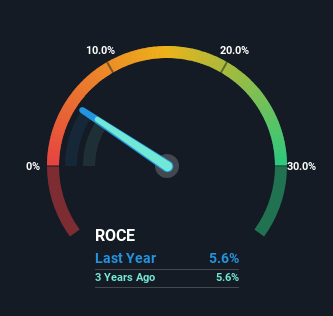
0.056 = NZ$12m ÷ (NZ$248m - NZ$29m) (Based on the trailing twelve months to June 2023).
So, Foley Wines has an ROCE of 5.6%. On its own that's a low return, but compared to the average of 3.8% generated by the Beverage industry, it's much better.
Check out our latest analysis for Foley Wines
While the past is not representative of the future, it can be helpful to know how a company has performed historically, which is why we have this chart above. If you want to delve into the historical earnings, revenue and cash flow of Foley Wines, check out these free graphs here.
What Can We Tell From Foley Wines' ROCE Trend?
Even though ROCE is still low in absolute terms, it's good to see it's heading in the right direction. The numbers show that in the last five years, the returns generated on capital employed have grown considerably to 5.6%. Basically the business is earning more per dollar of capital invested and in addition to that, 91% more capital is being employed now too. The increasing returns on a growing amount of capital is common amongst multi-baggers and that's why we're impressed.
What We Can Learn From Foley Wines' ROCE
All in all, it's terrific to see that Foley Wines is reaping the rewards from prior investments and is growing its capital base. Given the stock has declined 20% in the last five years, this could be a good investment if the valuation and other metrics are also appealing. With that in mind, we believe the promising trends warrant this stock for further investigation.
Foley Wines does have some risks, we noticed 4 warning signs (and 1 which is concerning) we think you should know about.
If you want to search for solid companies with great earnings, check out this free list of companies with good balance sheets and impressive returns on equity.
Have feedback on this article? Concerned about the content? Get in touch with us directly. Alternatively, email editorial-team (at) simplywallst.com.
This article by Simply Wall St is general in nature. We provide commentary based on historical data and analyst forecasts only using an unbiased methodology and our articles are not intended to be financial advice. It does not constitute a recommendation to buy or sell any stock, and does not take account of your objectives, or your financial situation. We aim to bring you long-term focused analysis driven by fundamental data. Note that our analysis may not factor in the latest price-sensitive company announcements or qualitative material. Simply Wall St has no position in any stocks mentioned.
