
 Yahoo Finance
 Return Trends At Spire (NYSE:SR) Aren't Appealing
If we want to find a stock that could multiply over the long term, what are the underlying trends we should look for? One common approach is to try and find a company with returns on capital employed (ROCE) that are increasing, in conjunction with a growing amount of capital employed. If you see this, it typically means it's a company with a great business model and plenty of profitable reinvestment opportunities. However, after investigating Spire (NYSE:SR), we don't think it's current trends fit the mold of a multi-bagger.
Understanding Return On Capital Employed (ROCE)
For those who don't know, ROCE is a measure of a company's yearly pre-tax profit (its return), relative to the capital employed in the business. Analysts use this formula to calculate it for Spire:
Return on Capital Employed = Earnings Before Interest and Tax (EBIT) ÷ (Total Assets - Current Liabilities)
0.05 = US$454m ÷ (US$11b - US$1.7b) (Based on the trailing twelve months to March 2024).
Therefore, Spire has an ROCE of 5.0%. In absolute terms, that's a low return but it's around the Gas Utilities industry average of 6.2%.
View our latest analysis for Spire
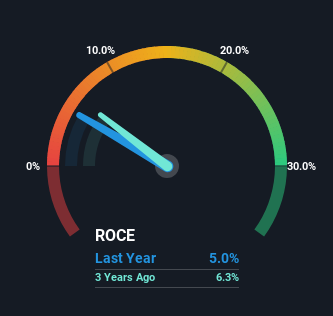
Above you can see how the current ROCE for Spire compares to its prior returns on capital, but there's only so much you can tell from the past. If you'd like, you can check out the forecasts from the analysts covering Spire for free.
What Can We Tell From Spire's ROCE Trend?
There are better returns on capital out there than what we're seeing at Spire. The company has employed 53% more capital in the last five years, and the returns on that capital have remained stable at 5.0%. Given the company has increased the amount of capital employed, it appears the investments that have been made simply don't provide a high return on capital.
The Key Takeaway
As we've seen above, Spire's returns on capital haven't increased but it is reinvesting in the business. Additionally, the stock's total return to shareholders over the last five years has been flat, which isn't too surprising. Therefore based on the analysis done in this article, we don't think Spire has the makings of a multi-bagger.
Spire does have some risks, we noticed 3 warning signs (and 1 which doesn't sit too well with us) we think you should know about.
For those who like to invest in solid companies, check out this free list of companies with solid balance sheets and high returns on equity.
Have feedback on this article? Concerned about the content? Get in touch with us directly. Alternatively, email editorial-team (at) simplywallst.com.
This article by Simply Wall St is general in nature. We provide commentary based on historical data and analyst forecasts only using an unbiased methodology and our articles are not intended to be financial advice. It does not constitute a recommendation to buy or sell any stock, and does not take account of your objectives, or your financial situation. We aim to bring you long-term focused analysis driven by fundamental data. Note that our analysis may not factor in the latest price-sensitive company announcements or qualitative material. Simply Wall St has no position in any stocks mentioned.
