
 Yahoo Finance
 The Return Trends At Vimeo (NASDAQ:VMEO) Look Promising
What trends should we look for it we want to identify stocks that can multiply in value over the long term? Firstly, we'd want to identify a growing return on capital employed (ROCE) and then alongside that, an ever-increasing base of capital employed. This shows us that it's a compounding machine, able to continually reinvest its earnings back into the business and generate higher returns. Speaking of which, we noticed some great changes in Vimeo's (NASDAQ:VMEO) returns on capital, so let's have a look.
Understanding Return On Capital Employed (ROCE)
For those who don't know, ROCE is a measure of a company's yearly pre-tax profit (its return), relative to the capital employed in the business. Analysts use this formula to calculate it for Vimeo:
Return on Capital Employed = Earnings Before Interest and Tax (EBIT) ÷ (Total Assets - Current Liabilities)
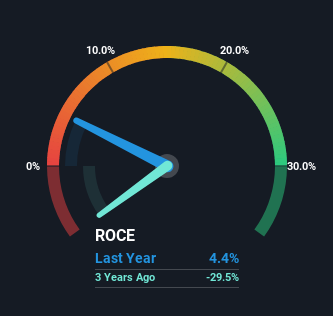
0.044 = US$18m ÷ (US$623m - US$227m) (Based on the trailing twelve months to December 2023).
So, Vimeo has an ROCE of 4.4%. Ultimately, that's a low return and it under-performs the Interactive Media and Services industry average of 6.4%.
View our latest analysis for Vimeo
Above you can see how the current ROCE for Vimeo compares to its prior returns on capital, but there's only so much you can tell from the past. If you'd like to see what analysts are forecasting going forward, you should check out our free analyst report for Vimeo .
What The Trend Of ROCE Can Tell Us
Vimeo has recently broken into profitability so their prior investments seem to be paying off. Shareholders would no doubt be pleased with this because the business was loss-making four years ago but is is now generating 4.4% on its capital. Not only that, but the company is utilizing 505% more capital than before, but that's to be expected from a company trying to break into profitability. This can tell us that the company has plenty of reinvestment opportunities that are able to generate higher returns.
In another part of our analysis, we noticed that the company's ratio of current liabilities to total assets decreased to 36%, which broadly means the business is relying less on its suppliers or short-term creditors to fund its operations. So shareholders would be pleased that the growth in returns has mostly come from underlying business performance.
Our Take On Vimeo's ROCE
In summary, it's great to see that Vimeo has managed to break into profitability and is continuing to reinvest in its business. Investors may not be impressed by the favorable underlying trends yet because over the last year the stock has only returned 5.3% to shareholders. So exploring more about this stock could uncover a good opportunity, if the valuation and other metrics stack up.
Vimeo does have some risks though, and we've spotted 1 warning sign for Vimeo that you might be interested in.
While Vimeo isn't earning the highest return, check out this free list of companies that are earning high returns on equity with solid balance sheets.
Have feedback on this article? Concerned about the content? Get in touch with us directly. Alternatively, email editorial-team (at) simplywallst.com.
This article by Simply Wall St is general in nature. We provide commentary based on historical data and analyst forecasts only using an unbiased methodology and our articles are not intended to be financial advice. It does not constitute a recommendation to buy or sell any stock, and does not take account of your objectives, or your financial situation. We aim to bring you long-term focused analysis driven by fundamental data. Note that our analysis may not factor in the latest price-sensitive company announcements or qualitative material. Simply Wall St has no position in any stocks mentioned.
