
 Yahoo Finance
 Returns At Bilfinger (ETR:GBF) Are On The Way Up
If we want to find a potential multi-bagger, often there are underlying trends that can provide clues. One common approach is to try and find a company with returns on capital employed (ROCE) that are increasing, in conjunction with a growing amount of capital employed. If you see this, it typically means it's a company with a great business model and plenty of profitable reinvestment opportunities. So on that note, Bilfinger (ETR:GBF) looks quite promising in regards to its trends of return on capital.
Return On Capital Employed (ROCE): What Is It?
Just to clarify if you're unsure, ROCE is a metric for evaluating how much pre-tax income (in percentage terms) a company earns on the capital invested in its business. To calculate this metric for Bilfinger, this is the formula:
Return on Capital Employed = Earnings Before Interest and Tax (EBIT) ÷ (Total Assets - Current Liabilities)
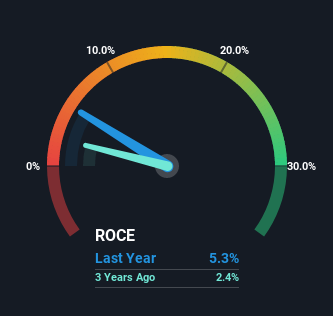
0.053 = €96m ÷ (€3.0b - €1.2b) (Based on the trailing twelve months to September 2022).
Therefore, Bilfinger has an ROCE of 5.3%. In absolute terms, that's a low return and it also under-performs the Commercial Services industry average of 9.0%.
Check out our latest analysis for Bilfinger
In the above chart we have measured Bilfinger's prior ROCE against its prior performance, but the future is arguably more important. If you'd like to see what analysts are forecasting going forward, you should check out our free report for Bilfinger.
So How Is Bilfinger's ROCE Trending?
We're pretty happy with how the ROCE has been trending at Bilfinger. We found that the returns on capital employed over the last five years have risen by 649%. That's not bad because this tells for every dollar invested (capital employed), the company is increasing the amount earned from that dollar. Speaking of capital employed, the company is actually utilizing 22% less than it was five years ago, which can be indicative of a business that's improving its efficiency. Bilfinger may be selling some assets so it's worth investigating if the business has plans for future investments to increase returns further still.
Another thing to note, Bilfinger has a high ratio of current liabilities to total assets of 41%. This effectively means that suppliers (or short-term creditors) are funding a large portion of the business, so just be aware that this can introduce some elements of risk. While it's not necessarily a bad thing, it can be beneficial if this ratio is lower.
The Key Takeaway
In summary, it's great to see that Bilfinger has been able to turn things around and earn higher returns on lower amounts of capital. Since the stock has only returned 1.6% to shareholders over the last five years, the promising fundamentals may not be recognized yet by investors. So exploring more about this stock could uncover a good opportunity, if the valuation and other metrics stack up.
On a separate note, we've found 3 warning signs for Bilfinger you'll probably want to know about.
While Bilfinger isn't earning the highest return, check out this free list of companies that are earning high returns on equity with solid balance sheets.
Have feedback on this article? Concerned about the content? Get in touch with us directly. Alternatively, email editorial-team (at) simplywallst.com.
This article by Simply Wall St is general in nature. We provide commentary based on historical data and analyst forecasts only using an unbiased methodology and our articles are not intended to be financial advice. It does not constitute a recommendation to buy or sell any stock, and does not take account of your objectives, or your financial situation. We aim to bring you long-term focused analysis driven by fundamental data. Note that our analysis may not factor in the latest price-sensitive company announcements or qualitative material. Simply Wall St has no position in any stocks mentioned.
Join A Paid User Research Session
You’ll receive a US$30 Amazon Gift card for 1 hour of your time while helping us build better investing tools for the individual investors like yourself. Sign up here
