
 Yahoo Finance
 The Returns On Capital At NEXTDC (ASX:NXT) Don't Inspire Confidence
What are the early trends we should look for to identify a stock that could multiply in value over the long term? Ideally, a business will show two trends; firstly a growing return on capital employed (ROCE) and secondly, an increasing amount of capital employed. This shows us that it's a compounding machine, able to continually reinvest its earnings back into the business and generate higher returns. Having said that, from a first glance at NEXTDC (ASX:NXT) we aren't jumping out of our chairs at how returns are trending, but let's have a deeper look.
What Is Return On Capital Employed (ROCE)?
For those who don't know, ROCE is a measure of a company's yearly pre-tax profit (its return), relative to the capital employed in the business. Analysts use this formula to calculate it for NEXTDC:
Return on Capital Employed = Earnings Before Interest and Tax (EBIT) ÷ (Total Assets - Current Liabilities)
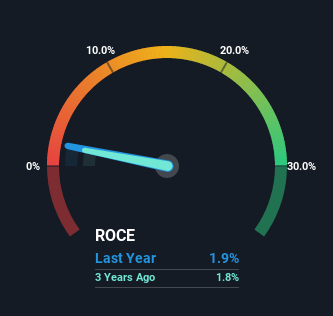
0.019 = AU$55m ÷ (AU$3.0b - AU$104m) (Based on the trailing twelve months to June 2022).
Therefore, NEXTDC has an ROCE of 1.9%. In absolute terms, that's a low return and it also under-performs the IT industry average of 6.6%.
See our latest analysis for NEXTDC
Above you can see how the current ROCE for NEXTDC compares to its prior returns on capital, but there's only so much you can tell from the past. If you're interested, you can view the analysts predictions in our free report on analyst forecasts for the company.
The Trend Of ROCE
In terms of NEXTDC's historical ROCE movements, the trend isn't fantastic. To be more specific, ROCE has fallen from 3.1% over the last five years. Although, given both revenue and the amount of assets employed in the business have increased, it could suggest the company is investing in growth, and the extra capital has led to a short-term reduction in ROCE. If these investments prove successful, this can bode very well for long term stock performance.
Our Take On NEXTDC's ROCE
In summary, despite lower returns in the short term, we're encouraged to see that NEXTDC is reinvesting for growth and has higher sales as a result. And the stock has followed suit returning a meaningful 59% to shareholders over the last five years. So while investors seem to be recognizing these promising trends, we would look further into this stock to make sure the other metrics justify the positive view.
NEXTDC does have some risks though, and we've spotted 1 warning sign for NEXTDC that you might be interested in.
If you want to search for solid companies with great earnings, check out this free list of companies with good balance sheets and impressive returns on equity.
Have feedback on this article? Concerned about the content? Get in touch with us directly. Alternatively, email editorial-team (at) simplywallst.com.
This article by Simply Wall St is general in nature. We provide commentary based on historical data and analyst forecasts only using an unbiased methodology and our articles are not intended to be financial advice. It does not constitute a recommendation to buy or sell any stock, and does not take account of your objectives, or your financial situation. We aim to bring you long-term focused analysis driven by fundamental data. Note that our analysis may not factor in the latest price-sensitive company announcements or qualitative material. Simply Wall St has no position in any stocks mentioned.
Join A Paid User Research Session
You’ll receive a US$30 Amazon Gift card for 1 hour of your time while helping us build better investing tools for the individual investors like yourself. Sign up here
