
 Yahoo Finance
 The Returns On Capital At Ruth's Hospitality Group (NASDAQ:RUTH) Don't Inspire Confidence
If you're looking for a multi-bagger, there's a few things to keep an eye out for. Firstly, we'd want to identify a growing return on capital employed (ROCE) and then alongside that, an ever-increasing base of capital employed. If you see this, it typically means it's a company with a great business model and plenty of profitable reinvestment opportunities. However, after investigating Ruth's Hospitality Group (NASDAQ:RUTH), we don't think it's current trends fit the mold of a multi-bagger.
Understanding Return On Capital Employed (ROCE)
If you haven't worked with ROCE before, it measures the 'return' (pre-tax profit) a company generates from capital employed in its business. To calculate this metric for Ruth's Hospitality Group, this is the formula:
Return on Capital Employed = Earnings Before Interest and Tax (EBIT) ÷ (Total Assets - Current Liabilities)
0.11 = US$43m ÷ (US$501m - US$107m) (Based on the trailing twelve months to September 2021).
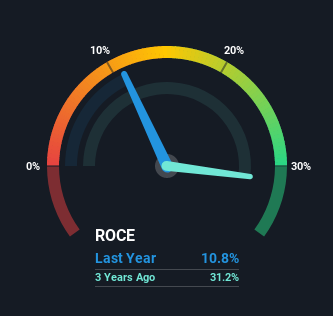
Therefore, Ruth's Hospitality Group has an ROCE of 11%. In absolute terms, that's a satisfactory return, but compared to the Hospitality industry average of 7.5% it's much better.
Check out our latest analysis for Ruth's Hospitality Group
In the above chart we have measured Ruth's Hospitality Group's prior ROCE against its prior performance, but the future is arguably more important. If you're interested, you can view the analysts predictions in our free report on analyst forecasts for the company.
How Are Returns Trending?
On the surface, the trend of ROCE at Ruth's Hospitality Group doesn't inspire confidence. To be more specific, ROCE has fallen from 46% over the last five years. However, given capital employed and revenue have both increased it appears that the business is currently pursuing growth, at the consequence of short term returns. If these investments prove successful, this can bode very well for long term stock performance.
On a side note, Ruth's Hospitality Group has done well to pay down its current liabilities to 21% of total assets. That could partly explain why the ROCE has dropped. Effectively this means their suppliers or short-term creditors are funding less of the business, which reduces some elements of risk. Some would claim this reduces the business' efficiency at generating ROCE since it is now funding more of the operations with its own money.
The Bottom Line
While returns have fallen for Ruth's Hospitality Group in recent times, we're encouraged to see that sales are growing and that the business is reinvesting in its operations. In light of this, the stock has only gained 24% over the last five years. So this stock may still be an appealing investment opportunity, if other fundamentals prove to be sound.
Like most companies, Ruth's Hospitality Group does come with some risks, and we've found 1 warning sign that you should be aware of.
If you want to search for solid companies with great earnings, check out this free list of companies with good balance sheets and impressive returns on equity.
This article by Simply Wall St is general in nature. We provide commentary based on historical data and analyst forecasts only using an unbiased methodology and our articles are not intended to be financial advice. It does not constitute a recommendation to buy or sell any stock, and does not take account of your objectives, or your financial situation. We aim to bring you long-term focused analysis driven by fundamental data. Note that our analysis may not factor in the latest price-sensitive company announcements or qualitative material. Simply Wall St has no position in any stocks mentioned.
Have feedback on this article? Concerned about the content? Get in touch with us directly. Alternatively, email editorial-team (at) simplywallst.com.
