
 Yahoo Finance
 Returns At Marlborough Wine Estates Group (NZSE:MWE) Are On The Way Up
There are a few key trends to look for if we want to identify the next multi-bagger. Typically, we'll want to notice a trend of growing return on capital employed (ROCE) and alongside that, an expanding base of capital employed. Ultimately, this demonstrates that it's a business that is reinvesting profits at increasing rates of return. So when we looked at Marlborough Wine Estates Group (NZSE:MWE) and its trend of ROCE, we really liked what we saw.
Understanding Return On Capital Employed (ROCE)
For those who don't know, ROCE is a measure of a company's yearly pre-tax profit (its return), relative to the capital employed in the business. To calculate this metric for Marlborough Wine Estates Group, this is the formula:
Return on Capital Employed = Earnings Before Interest and Tax (EBIT) ÷ (Total Assets - Current Liabilities)
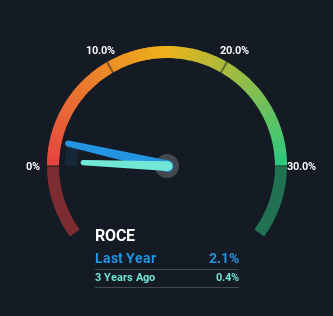
0.021 = NZ$871k ÷ (NZ$43m - NZ$2.1m) (Based on the trailing twelve months to June 2023).
Therefore, Marlborough Wine Estates Group has an ROCE of 2.1%. Ultimately, that's a low return and it under-performs the Beverage industry average of 3.8%.
View our latest analysis for Marlborough Wine Estates Group
While the past is not representative of the future, it can be helpful to know how a company has performed historically, which is why we have this chart above. If you'd like to look at how Marlborough Wine Estates Group has performed in the past in other metrics, you can view this free graph of past earnings, revenue and cash flow.
The Trend Of ROCE
The fact that Marlborough Wine Estates Group is now generating some pre-tax profits from its prior investments is very encouraging. About five years ago the company was generating losses but things have turned around because it's now earning 2.1% on its capital. Not only that, but the company is utilizing 189% more capital than before, but that's to be expected from a company trying to break into profitability. We like this trend, because it tells us the company has profitable reinvestment opportunities available to it, and if it continues going forward that can lead to a multi-bagger performance.
In another part of our analysis, we noticed that the company's ratio of current liabilities to total assets decreased to 4.9%, which broadly means the business is relying less on its suppliers or short-term creditors to fund its operations. So this improvement in ROCE has come from the business' underlying economics, which is great to see.
Our Take On Marlborough Wine Estates Group's ROCE
Overall, Marlborough Wine Estates Group gets a big tick from us thanks in most part to the fact that it is now profitable and is reinvesting in its business. And since the stock has fallen 63% over the last three years, there might be an opportunity here. That being the case, research into the company's current valuation metrics and future prospects seems fitting.
Like most companies, Marlborough Wine Estates Group does come with some risks, and we've found 1 warning sign that you should be aware of.
If you want to search for solid companies with great earnings, check out this free list of companies with good balance sheets and impressive returns on equity.
Have feedback on this article? Concerned about the content? Get in touch with us directly. Alternatively, email editorial-team (at) simplywallst.com.
This article by Simply Wall St is general in nature. We provide commentary based on historical data and analyst forecasts only using an unbiased methodology and our articles are not intended to be financial advice. It does not constitute a recommendation to buy or sell any stock, and does not take account of your objectives, or your financial situation. We aim to bring you long-term focused analysis driven by fundamental data. Note that our analysis may not factor in the latest price-sensitive company announcements or qualitative material. Simply Wall St has no position in any stocks mentioned.
