
 Yahoo Finance
 The Returns At Seacera Group Berhad (KLSE:SEACERA) Aren't Growing
To find a multi-bagger stock, what are the underlying trends we should look for in a business? Typically, we'll want to notice a trend of growing return on capital employed (ROCE) and alongside that, an expanding base of capital employed. Basically this means that a company has profitable initiatives that it can continue to reinvest in, which is a trait of a compounding machine. Having said that, from a first glance at Seacera Group Berhad (KLSE:SEACERA) we aren't jumping out of our chairs at how returns are trending, but let's have a deeper look.
What Is Return On Capital Employed (ROCE)?
For those who don't know, ROCE is a measure of a company's yearly pre-tax profit (its return), relative to the capital employed in the business. Analysts use this formula to calculate it for Seacera Group Berhad:
Return on Capital Employed = Earnings Before Interest and Tax (EBIT) ÷ (Total Assets - Current Liabilities)
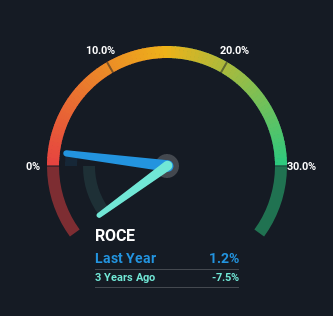
0.012 = RM9.5m ÷ (RM824m - RM24m) (Based on the trailing twelve months to December 2022).
Thus, Seacera Group Berhad has an ROCE of 1.2%. Ultimately, that's a low return and it under-performs the Building industry average of 2.3%.
View our latest analysis for Seacera Group Berhad
While the past is not representative of the future, it can be helpful to know how a company has performed historically, which is why we have this chart above. If you'd like to look at how Seacera Group Berhad has performed in the past in other metrics, you can view this free graph of past earnings, revenue and cash flow.
What Does the ROCE Trend For Seacera Group Berhad Tell Us?
Over the past five years, Seacera Group Berhad's ROCE and capital employed have both remained mostly flat. Businesses with these traits tend to be mature and steady operations because they're past the growth phase. So don't be surprised if Seacera Group Berhad doesn't end up being a multi-bagger in a few years time.
On a side note, Seacera Group Berhad has done well to reduce current liabilities to 2.9% of total assets over the last five years. This can eliminate some of the risks inherent in the operations because the business has less outstanding obligations to their suppliers and or short-term creditors than they did previously.
The Bottom Line On Seacera Group Berhad's ROCE
In summary, Seacera Group Berhad isn't compounding its earnings but is generating stable returns on the same amount of capital employed. And investors appear hesitant that the trends will pick up because the stock has fallen 68% in the last five years. On the whole, we aren't too inspired by the underlying trends and we think there may be better chances of finding a multi-bagger elsewhere.
Seacera Group Berhad does have some risks though, and we've spotted 2 warning signs for Seacera Group Berhad that you might be interested in.
While Seacera Group Berhad isn't earning the highest return, check out this free list of companies that are earning high returns on equity with solid balance sheets.
Have feedback on this article? Concerned about the content? Get in touch with us directly. Alternatively, email editorial-team (at) simplywallst.com.
This article by Simply Wall St is general in nature. We provide commentary based on historical data and analyst forecasts only using an unbiased methodology and our articles are not intended to be financial advice. It does not constitute a recommendation to buy or sell any stock, and does not take account of your objectives, or your financial situation. We aim to bring you long-term focused analysis driven by fundamental data. Note that our analysis may not factor in the latest price-sensitive company announcements or qualitative material. Simply Wall St has no position in any stocks mentioned.
Join A Paid User Research Session
You’ll receive a US$30 Amazon Gift card for 1 hour of your time while helping us build better investing tools for the individual investors like yourself. Sign up here
