
 Yahoo Finance
 Sabre (SABR) Posts Narrower Q1 Loss, Beats Revenue Estimates

Sabre Corporation SABR reported better-than-expected results for the first quarter of 2024. The company reported an adjusted loss of 2 cents per share, narrower than the Zacks Consensus Estimate of a loss of 5 cents per share. Moreover, the figure was narrower than the year-ago quarter’s loss of 18 cents per share.
The year-over-year improvement in the bottom line reflects the benefits of increased revenues and cost-improvement implementations that lowered the company’s technology and SG&A expenses.
Sabre reported revenues of $782.9 million, surpassing the consensus mark of $751 million. The top line was 5.4% higher than $742.7 million in the year-ago period.
This year-over-year surge in the top line reflects a significant improvement in global air, hotel and other travel bookings. Additionally, the company's Travel Solutions division benefited from favorable rates as international and corporate bookings continued to improve. The company also registered a higher average booking fee and improved its cost structures.
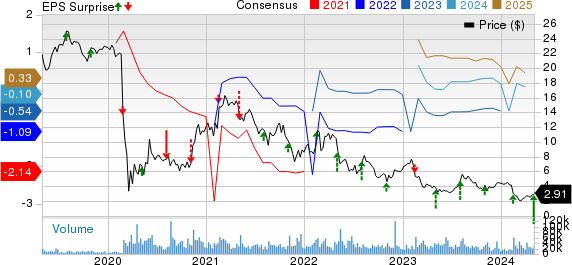
Sabre Corporation Price, Consensus and EPS Surprise
Sabre Corporation price-consensus-eps-surprise-chart | Sabre Corporation Quote
Quarter in Detail
The Travel Solutions segment’s revenues increased 5% year over year to $713.6 million. The growth in this segment was led by a rise in bookings across global air and hotel. The segment also benefited from favorable rates from the travel supplier mix. Our model estimates for Travel Solutions revenues were pegged at $678.6 million, which indicated 0.2% year-over-year growth.
Distribution’s (a sub-division of Travel Solutions) revenues improved 9% to $572.3 million. The distribution segment registered growth in the number of bookings and benefited from a favorable shift in the booking mix and higher average booking fees. Our model estimates for Distribution revenues were pegged at $532.4 million, which indicated 1.2% year-over-year growth.
IT Solutions’ (a sub-division of Travel Solutions) revenues were $141.4 million, down 7% year over year. The decrease in performance was due to lower revenues from de-migrations. Our model estimates for IT Solution revenues were pegged at $146.2 million, which indicated a 3.6% year-over-year decline.
The Hospitality Solutions segment’s revenues were $78.8 million compared with the year-ago quarter's $73.8 million. This segment experienced a rise in central reservation system transactions caused by new customer inflow and a favorable mix within the customer base. Our model estimates for Hospitality Solutions revenues were pegged at $83.7 million, which indicated 13.4% year-over-year growth.
Sabre reported an adjusted operating income of $118 million, significantly improving from the operating income of $28 million posted in the year-earlier period. Adjusted EBITDA improved from $58 million reported a year ago to $142.3 million.
Balance Sheet and Cash Flow
Sabre exited the March-end quarter with cash, cash equivalents and restricted cash of $650.2 million compared with the previous quarter’s $648.2 million.
In the first quarter, Sabre utilized cash of $68 million in operating activities and had a negative free cash flow of $96 million.
Revised Financial Outlook
Sabre initiated guidance for the second quarter and full year 2024. For the second quarter, the company anticipates revenues of approximately $750 million, which is marginally lower than the Zacks Consensus Estimate of $753.6 million. It anticipates adjusted EBITDA of $115 million and also expects to have a positive free cash flow.
For the full year 2024, Sabre anticipates revenues of approximately $3.04 billion, which is marginally higher than the Zacks Consensus Estimate of $3.01 billion. It anticipates adjusted EBITDA of more than $520 million and expects to have positive free cash flow. The company’s revenues and adjusted EBITDA guidance has been increased from the prior guidance of $3.0 billion of revenues and $500 million of EBITDA.
Zacks Rank and Stocks to Consider
Sabre carries a current Zacks Rank #3 (Hold). Shares of the company have lost 22.4% in the past year.
Some better-ranked stocks from the broader technology sector are Arista Networks ANET, Crexendo CXDO and Dell Technologies DELL. While CXDO sports a Zacks Rank #1 (Strong Buy), DELL and ANET each carry a Zacks Rank #2 (Buy), at present. You can see the complete list of today’s Zacks #1 Rank stocks here.
The Zacks Consensus Estimate for ANET's 2024 earnings per share has been revised upward 3 cents to $7.49 in the past 30 days. Shares of the company have rallied 93.5% in the past year.
The consensus estimate for CXDO’s 2024 earnings per share has been revised upward 6 cents to 23 cents in the past 60 days. Shares of the company have skyrocketed 197.4% in the past year.
The Zacks Consensus Estimate for DELL’s 2024 earnings per share has been revised upward 17 cents to $7.64 in the past 60 days. Shares of the company have surged 179.3% in the past year.
Want the latest recommendations from Zacks Investment Research? Today, you can download 7 Best Stocks for the Next 30 Days. Click to get this free report
Dell Technologies Inc. (DELL) : Free Stock Analysis Report
Sabre Corporation (SABR) : Free Stock Analysis Report
Arista Networks, Inc. (ANET) : Free Stock Analysis Report
Crexendo Inc. (CXDO) : Free Stock Analysis Report
