
 Yahoo Finance
 Schaffer Corporation Limited's (ASX:SFC) Has Performed Well But Fundamentals Look Varied: Is There A Clear Direction For The Stock?
Schaffer's (ASX:SFC) stock up by 7.0% over the past three months. However, the company's financials look a bit inconsistent and market outcomes are ultimately driven by long-term fundamentals, meaning that the stock could head in either direction. In this article, we decided to focus on Schaffer's ROE.
ROE or return on equity is a useful tool to assess how effectively a company can generate returns on the investment it received from its shareholders. In short, ROE shows the profit each dollar generates with respect to its shareholder investments.
See our latest analysis for Schaffer
How To Calculate Return On Equity?
The formula for return on equity is:
Return on Equity = Net Profit (from continuing operations) ÷ Shareholders' Equity
So, based on the above formula, the ROE for Schaffer is:
9.1% = AU$20m ÷ AU$226m (Based on the trailing twelve months to December 2023).
The 'return' is the profit over the last twelve months. So, this means that for every A$1 of its shareholder's investments, the company generates a profit of A$0.09.
What Has ROE Got To Do With Earnings Growth?
So far, we've learned that ROE is a measure of a company's profitability. We now need to evaluate how much profit the company reinvests or "retains" for future growth which then gives us an idea about the growth potential of the company. Assuming all else is equal, companies that have both a higher return on equity and higher profit retention are usually the ones that have a higher growth rate when compared to companies that don't have the same features.
Schaffer's Earnings Growth And 9.1% ROE
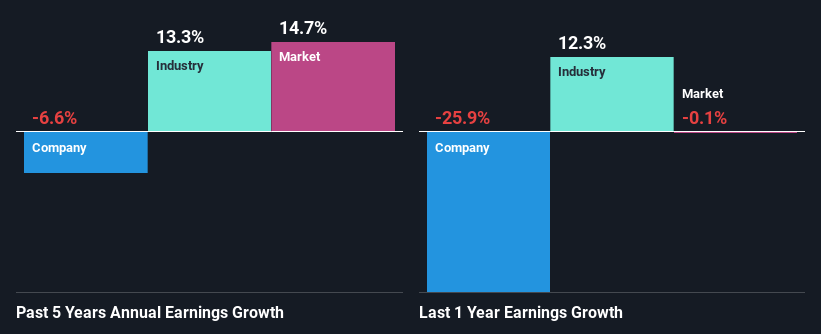
On the face of it, Schaffer's ROE is not much to talk about. A quick further study shows that the company's ROE doesn't compare favorably to the industry average of 12% either. Therefore, it might not be wrong to say that the five year net income decline of 6.6% seen by Schaffer was probably the result of it having a lower ROE. We reckon that there could also be other factors at play here. For example, it is possible that the business has allocated capital poorly or that the company has a very high payout ratio.
So, as a next step, we compared Schaffer's performance against the industry and were disappointed to discover that while the company has been shrinking its earnings, the industry has been growing its earnings at a rate of 13% over the last few years.
Earnings growth is an important metric to consider when valuing a stock. The investor should try to establish if the expected growth or decline in earnings, whichever the case may be, is priced in. By doing so, they will have an idea if the stock is headed into clear blue waters or if swampy waters await. If you're wondering about Schaffer's's valuation, check out this gauge of its price-to-earnings ratio, as compared to its industry.
Is Schaffer Using Its Retained Earnings Effectively?
Looking at its three-year median payout ratio of 47% (or a retention ratio of 53%) which is pretty normal, Schaffer's declining earnings is rather baffling as one would expect to see a fair bit of growth when a company is retaining a good portion of its profits. So there might be other factors at play here which could potentially be hampering growth. For example, the business has faced some headwinds.
Additionally, Schaffer has paid dividends over a period of at least ten years, which means that the company's management is determined to pay dividends even if it means little to no earnings growth.
Conclusion
On the whole, we feel that the performance shown by Schaffer can be open to many interpretations. Even though it appears to be retaining most of its profits, given the low ROE, investors may not be benefitting from all that reinvestment after all. The low earnings growth suggests our theory correct. Wrapping up, we would proceed with caution with this company and one way of doing that would be to look at the risk profile of the business. You can see the 3 risks we have identified for Schaffer by visiting our risks dashboard for free on our platform here.
Have feedback on this article? Concerned about the content? Get in touch with us directly. Alternatively, email editorial-team (at) simplywallst.com.
This article by Simply Wall St is general in nature. We provide commentary based on historical data and analyst forecasts only using an unbiased methodology and our articles are not intended to be financial advice. It does not constitute a recommendation to buy or sell any stock, and does not take account of your objectives, or your financial situation. We aim to bring you long-term focused analysis driven by fundamental data. Note that our analysis may not factor in the latest price-sensitive company announcements or qualitative material. Simply Wall St has no position in any stocks mentioned.
