
 Yahoo Finance
 Science Applications International's (NYSE:SAIC) Dividend Will Be US$0.37
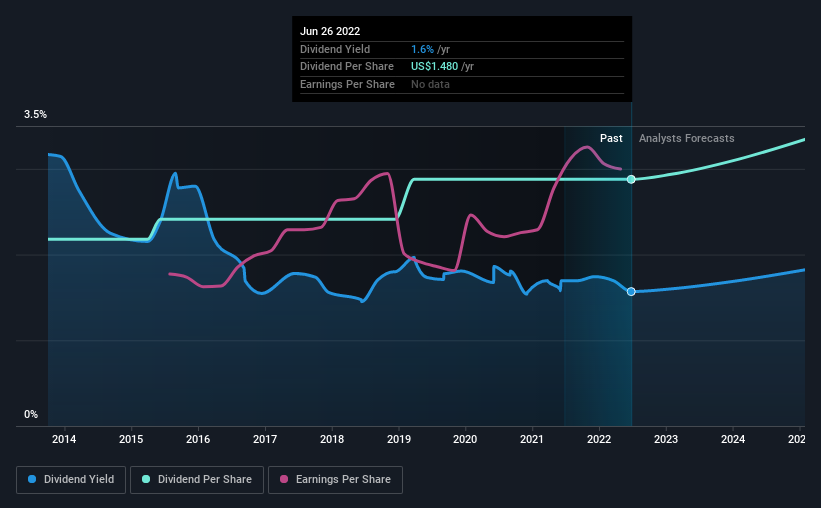
Science Applications International Corporation's (NYSE:SAIC) investors are due to receive a payment of US$0.37 per share on 29th of July. The dividend yield will be 1.6% based on this payment which is still above the industry average.
View our latest analysis for Science Applications International
Science Applications International's Earnings Easily Cover the Distributions
A big dividend yield for a few years doesn't mean much if it can't be sustained. However, prior to this announcement, Science Applications International's dividend was comfortably covered by both cash flow and earnings. This means that most of what the business earns is being used to help it grow.
The next year is set to see EPS grow by 14.9%. If the dividend continues on this path, the payout ratio could be 28% by next year, which we think can be pretty sustainable going forward.
Science Applications International Doesn't Have A Long Payment History
Science Applications International's dividend has been pretty stable for a little while now, but we will continue to be cautious until it has been demonstrated for a few more years. Since 2013, the first annual payment was US$1.12, compared to the most recent full-year payment of US$1.48. This works out to be a compound annual growth rate (CAGR) of approximately 3.1% a year over that time. We like that the dividend hasn't been shrinking. However we're conscious that the company hasn't got an overly long track record of dividend payments yet, which makes us wary of relying on its dividend income.
Science Applications International Could Grow Its Dividend
Investors who have held shares in the company for the past few years will be happy with the dividend income they have received. Science Applications International has seen EPS rising for the last five years, at 6.1% per annum. Science Applications International definitely has the potential to grow its dividend in the future with earnings on an uptrend and a low payout ratio.
In Summary
In summary, we are pleased with the dividend remaining consistent, and we think there is a good chance of this continuing in the future. The payout ratio looks good, but unfortunately the company's dividend track record isn't stellar. The dividend looks okay, but there have been some issues in the past, so we would be a little bit cautious.
It's important to note that companies having a consistent dividend policy will generate greater investor confidence than those having an erratic one. At the same time, there are other factors our readers should be conscious of before pouring capital into a stock. For example, we've identified 2 warning signs for Science Applications International (1 is a bit concerning!) that you should be aware of before investing. If you are a dividend investor, you might also want to look at our curated list of high yield dividend stocks.
Have feedback on this article? Concerned about the content? Get in touch with us directly. Alternatively, email editorial-team (at) simplywallst.com.
This article by Simply Wall St is general in nature. We provide commentary based on historical data and analyst forecasts only using an unbiased methodology and our articles are not intended to be financial advice. It does not constitute a recommendation to buy or sell any stock, and does not take account of your objectives, or your financial situation. We aim to bring you long-term focused analysis driven by fundamental data. Note that our analysis may not factor in the latest price-sensitive company announcements or qualitative material. Simply Wall St has no position in any stocks mentioned.
