
 Yahoo Finance
 Scott Technology (NZSE:SCT) Has Some Way To Go To Become A Multi-Bagger
If we want to find a stock that could multiply over the long term, what are the underlying trends we should look for? Firstly, we'll want to see a proven return on capital employed (ROCE) that is increasing, and secondly, an expanding base of capital employed. Basically this means that a company has profitable initiatives that it can continue to reinvest in, which is a trait of a compounding machine. In light of that, when we looked at Scott Technology (NZSE:SCT) and its ROCE trend, we weren't exactly thrilled.
Understanding Return On Capital Employed (ROCE)
For those that aren't sure what ROCE is, it measures the amount of pre-tax profits a company can generate from the capital employed in its business. To calculate this metric for Scott Technology, this is the formula:
Return on Capital Employed = Earnings Before Interest and Tax (EBIT) ÷ (Total Assets - Current Liabilities)
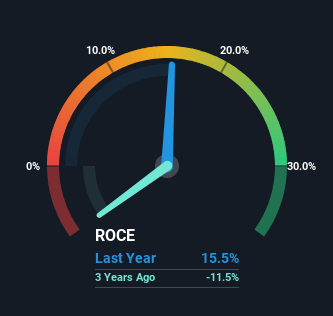
0.15 = NZ$21m ÷ (NZ$253m - NZ$117m) (Based on the trailing twelve months to August 2023).
Thus, Scott Technology has an ROCE of 15%. On its own, that's a standard return, however it's much better than the 10% generated by the Machinery industry.
Check out our latest analysis for Scott Technology
Above you can see how the current ROCE for Scott Technology compares to its prior returns on capital, but there's only so much you can tell from the past. If you're interested, you can view the analysts predictions in our free report on analyst forecasts for the company.
What The Trend Of ROCE Can Tell Us
Over the past five years, Scott Technology's ROCE and capital employed have both remained mostly flat. This tells us the company isn't reinvesting in itself, so it's plausible that it's past the growth phase. With that in mind, unless investment picks up again in the future, we wouldn't expect Scott Technology to be a multi-bagger going forward. With fewer investment opportunities, it makes sense that Scott Technology has been paying out a decent 42% of its earnings to shareholders. Given the business isn't reinvesting in itself, it makes sense to distribute a portion of earnings among shareholders.
Another thing to note, Scott Technology has a high ratio of current liabilities to total assets of 46%. This effectively means that suppliers (or short-term creditors) are funding a large portion of the business, so just be aware that this can introduce some elements of risk. While it's not necessarily a bad thing, it can be beneficial if this ratio is lower.
The Bottom Line On Scott Technology's ROCE
We can conclude that in regards to Scott Technology's returns on capital employed and the trends, there isn't much change to report on. And investors may be recognizing these trends since the stock has only returned a total of 29% to shareholders over the last five years. As a result, if you're hunting for a multi-bagger, we think you'd have more luck elsewhere.
Scott Technology could be trading at an attractive price in other respects, so you might find our free intrinsic value estimation on our platform quite valuable.
While Scott Technology may not currently earn the highest returns, we've compiled a list of companies that currently earn more than 25% return on equity. Check out this free list here.
Have feedback on this article? Concerned about the content? Get in touch with us directly. Alternatively, email editorial-team (at) simplywallst.com.
This article by Simply Wall St is general in nature. We provide commentary based on historical data and analyst forecasts only using an unbiased methodology and our articles are not intended to be financial advice. It does not constitute a recommendation to buy or sell any stock, and does not take account of your objectives, or your financial situation. We aim to bring you long-term focused analysis driven by fundamental data. Note that our analysis may not factor in the latest price-sensitive company announcements or qualitative material. Simply Wall St has no position in any stocks mentioned.
