
 Yahoo Finance
 Scotts Miracle-Gro (NYSE:SMG) sheds US$432m, company earnings and investor returns have been trending downwards for past year
Investing in stocks comes with the risk that the share price will fall. Anyone who held The Scotts Miracle-Gro Company (NYSE:SMG) over the last year knows what a loser feels like. In that relatively short period, the share price has plunged 60%. Longer term investors have fared much better, since the share price is up 12% in three years. Furthermore, it's down 28% in about a quarter. That's not much fun for holders. But this could be related to the weak market, which is down 16% in the same period.
Given the past week has been tough on shareholders, let's investigate the fundamentals and see what we can learn.
See our latest analysis for Scotts Miracle-Gro
There is no denying that markets are sometimes efficient, but prices do not always reflect underlying business performance. One flawed but reasonable way to assess how sentiment around a company has changed is to compare the earnings per share (EPS) with the share price.
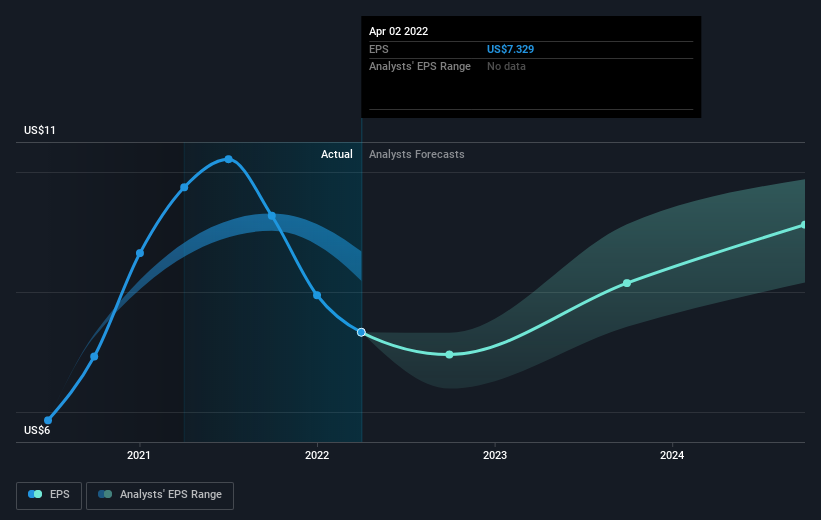
Unhappily, Scotts Miracle-Gro had to report a 25% decline in EPS over the last year. The share price decline of 60% is actually more than the EPS drop. This suggests the EPS fall has made some shareholders are more nervous about the business.
The company's earnings per share (over time) is depicted in the image below (click to see the exact numbers).
We consider it positive that insiders have made significant purchases in the last year. Having said that, most people consider earnings and revenue growth trends to be a more meaningful guide to the business. This free interactive report on Scotts Miracle-Gro's earnings, revenue and cash flow is a great place to start, if you want to investigate the stock further.
A Different Perspective
While the broader market lost about 9.8% in the twelve months, Scotts Miracle-Gro shareholders did even worse, losing 59% (even including dividends). Having said that, it's inevitable that some stocks will be oversold in a falling market. The key is to keep your eyes on the fundamental developments. On the bright side, long term shareholders have made money, with a gain of 5% per year over half a decade. It could be that the recent sell-off is an opportunity, so it may be worth checking the fundamental data for signs of a long term growth trend. I find it very interesting to look at share price over the long term as a proxy for business performance. But to truly gain insight, we need to consider other information, too. To that end, you should learn about the 4 warning signs we've spotted with Scotts Miracle-Gro (including 1 which is significant) .
Scotts Miracle-Gro is not the only stock that insiders are buying. For those who like to find winning investments this free list of growing companies with recent insider purchasing, could be just the ticket.
Please note, the market returns quoted in this article reflect the market weighted average returns of stocks that currently trade on US exchanges.
Have feedback on this article? Concerned about the content? Get in touch with us directly. Alternatively, email editorial-team (at) simplywallst.com.
This article by Simply Wall St is general in nature. We provide commentary based on historical data and analyst forecasts only using an unbiased methodology and our articles are not intended to be financial advice. It does not constitute a recommendation to buy or sell any stock, and does not take account of your objectives, or your financial situation. We aim to bring you long-term focused analysis driven by fundamental data. Note that our analysis may not factor in the latest price-sensitive company announcements or qualitative material. Simply Wall St has no position in any stocks mentioned.
