
 Yahoo Finance
 Is Sea (NYSE:SE) Using Debt In A Risky Way?
Warren Buffett famously said, 'Volatility is far from synonymous with risk.' So it seems the smart money knows that debt - which is usually involved in bankruptcies - is a very important factor, when you assess how risky a company is. We can see that Sea Limited (NYSE:SE) does use debt in its business. But the more important question is: how much risk is that debt creating?
When Is Debt Dangerous?
Debt assists a business until the business has trouble paying it off, either with new capital or with free cash flow. If things get really bad, the lenders can take control of the business. However, a more usual (but still expensive) situation is where a company must dilute shareholders at a cheap share price simply to get debt under control. Of course, the upside of debt is that it often represents cheap capital, especially when it replaces dilution in a company with the ability to reinvest at high rates of return. The first thing to do when considering how much debt a business uses is to look at its cash and debt together.
Check out our latest analysis for Sea
What Is Sea's Net Debt?
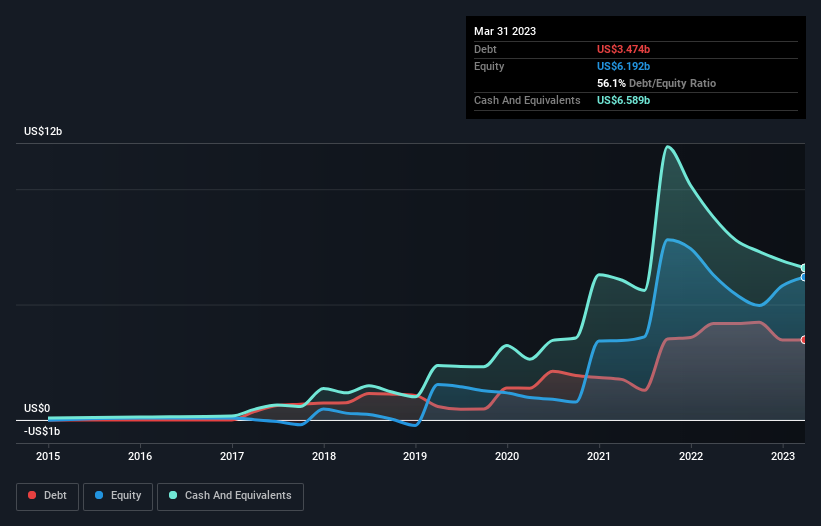
As you can see below, Sea had US$3.47b of debt at March 2023, down from US$4.18b a year prior. But it also has US$6.59b in cash to offset that, meaning it has US$3.12b net cash.
How Healthy Is Sea's Balance Sheet?
According to the last reported balance sheet, Sea had liabilities of US$6.66b due within 12 months, and liabilities of US$4.39b due beyond 12 months. Offsetting this, it had US$6.59b in cash and US$2.25b in receivables that were due within 12 months. So it has liabilities totalling US$2.22b more than its cash and near-term receivables, combined.
Of course, Sea has a titanic market capitalization of US$32.5b, so these liabilities are probably manageable. Having said that, it's clear that we should continue to monitor its balance sheet, lest it change for the worse. Despite its noteworthy liabilities, Sea boasts net cash, so it's fair to say it does not have a heavy debt load! There's no doubt that we learn most about debt from the balance sheet. But ultimately the future profitability of the business will decide if Sea can strengthen its balance sheet over time. So if you want to see what the professionals think, you might find this free report on analyst profit forecasts to be interesting.
Over 12 months, Sea reported revenue of US$13b, which is a gain of 14%, although it did not report any earnings before interest and tax. That rate of growth is a bit slow for our taste, but it takes all types to make a world.
So How Risky Is Sea?
By their very nature companies that are losing money are more risky than those with a long history of profitability. And the fact is that over the last twelve months Sea lost money at the earnings before interest and tax (EBIT) line. And over the same period it saw negative free cash outflow of US$804m and booked a US$984m accounting loss. But the saving grace is the US$3.12b on the balance sheet. That means it could keep spending at its current rate for more than two years. Summing up, we're a little skeptical of this one, as it seems fairly risky in the absence of free cashflow. When we look at a riskier company, we like to check how their profits (or losses) are trending over time. Today, we're providing readers this interactive graph showing how Sea's profit, revenue, and operating cashflow have changed over the last few years.
Of course, if you're the type of investor who prefers buying stocks without the burden of debt, then don't hesitate to discover our exclusive list of net cash growth stocks, today.
Have feedback on this article? Concerned about the content? Get in touch with us directly. Alternatively, email editorial-team (at) simplywallst.com.
This article by Simply Wall St is general in nature. We provide commentary based on historical data and analyst forecasts only using an unbiased methodology and our articles are not intended to be financial advice. It does not constitute a recommendation to buy or sell any stock, and does not take account of your objectives, or your financial situation. We aim to bring you long-term focused analysis driven by fundamental data. Note that our analysis may not factor in the latest price-sensitive company announcements or qualitative material. Simply Wall St has no position in any stocks mentioned.
Join A Paid User Research Session
You’ll receive a US$30 Amazon Gift card for 1 hour of your time while helping us build better investing tools for the individual investors like yourself. Sign up here
