
 Yahoo Finance
 Shareholders in Asset Plus (NZSE:APL) are in the red if they invested five years ago
In order to justify the effort of selecting individual stocks, it's worth striving to beat the returns from a market index fund. But even the best stock picker will only win with some selections. So we wouldn't blame long term Asset Plus Limited (NZSE:APL) shareholders for doubting their decision to hold, with the stock down 60% over a half decade.
Now let's have a look at the company's fundamentals, and see if the long term shareholder return has matched the performance of the underlying business.
See our latest analysis for Asset Plus
Given that Asset Plus didn't make a profit in the last twelve months, we'll focus on revenue growth to form a quick view of its business development. When a company doesn't make profits, we'd generally expect to see good revenue growth. As you can imagine, fast revenue growth, when maintained, often leads to fast profit growth.
Over half a decade Asset Plus reduced its trailing twelve month revenue by 10% for each year. That's definitely a weaker result than most pre-profit companies report. Arguably, the market has responded appropriately to this business performance by sending the share price down 10% (annualized) in the same time period. We don't generally like to own companies that lose money and don't grow revenues. You might be better off spending your money on a leisure activity. This looks like a really risky stock to buy, at a glance.
You can see how earnings and revenue have changed over time in the image below (click on the chart to see the exact values).
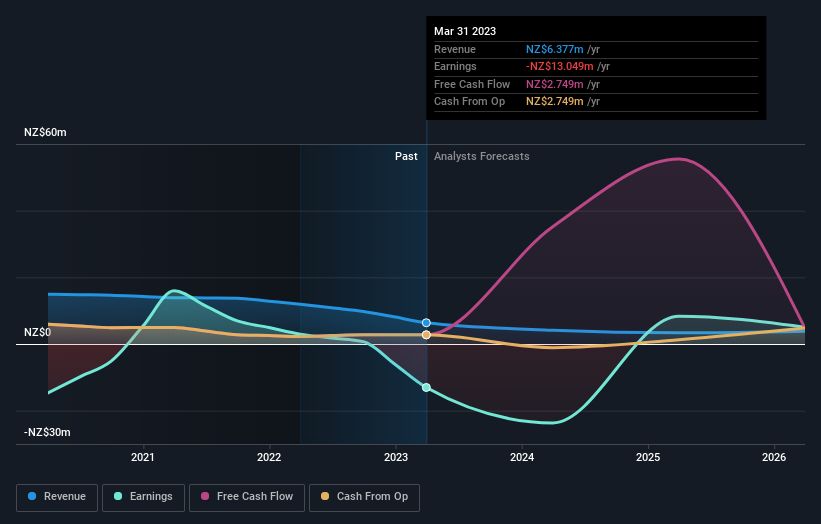
Balance sheet strength is crucial. It might be well worthwhile taking a look at our free report on how its financial position has changed over time.
What About The Total Shareholder Return (TSR)?
We've already covered Asset Plus' share price action, but we should also mention its total shareholder return (TSR). Arguably the TSR is a more complete return calculation because it accounts for the value of dividends (as if they were reinvested), along with the hypothetical value of any discounted capital that have been offered to shareholders. Its history of dividend payouts mean that Asset Plus' TSR, which was a 47% drop over the last 5 years, was not as bad as the share price return.
A Different Perspective
Investors in Asset Plus had a tough year, with a total loss of 7.7%, against a market gain of about 1.5%. Even the share prices of good stocks drop sometimes, but we want to see improvements in the fundamental metrics of a business, before getting too interested. Unfortunately, longer term shareholders are suffering worse, given the loss of 8% doled out over the last five years. We'd need to see some sustained improvements in the key metrics before we could muster much enthusiasm. It's always interesting to track share price performance over the longer term. But to understand Asset Plus better, we need to consider many other factors. For instance, we've identified 3 warning signs for Asset Plus (1 can't be ignored) that you should be aware of.
Of course, you might find a fantastic investment by looking elsewhere. So take a peek at this free list of companies we expect will grow earnings.
Please note, the market returns quoted in this article reflect the market weighted average returns of stocks that currently trade on New Zealander exchanges.
Have feedback on this article? Concerned about the content? Get in touch with us directly. Alternatively, email editorial-team (at) simplywallst.com.
This article by Simply Wall St is general in nature. We provide commentary based on historical data and analyst forecasts only using an unbiased methodology and our articles are not intended to be financial advice. It does not constitute a recommendation to buy or sell any stock, and does not take account of your objectives, or your financial situation. We aim to bring you long-term focused analysis driven by fundamental data. Note that our analysis may not factor in the latest price-sensitive company announcements or qualitative material. Simply Wall St has no position in any stocks mentioned.
