
 Yahoo Finance
 Shareholders in Beam Global (NASDAQ:BEEM) are in the red if they invested three years ago
Every investor on earth makes bad calls sometimes. But really big losses can really drag down an overall portfolio. So consider, for a moment, the misfortune of Beam Global (NASDAQ:BEEM) investors who have held the stock for three years as it declined a whopping 82%. That'd be enough to cause even the strongest minds some disquiet. And the ride hasn't got any smoother in recent times over the last year, with the price 58% lower in that time. Shareholders have had an even rougher run lately, with the share price down 11% in the last 90 days. We really hope anyone holding through that price crash has a diversified portfolio. Even when you lose money, you don't have to lose the lesson.
It's worthwhile assessing if the company's economics have been moving in lockstep with these underwhelming shareholder returns, or if there is some disparity between the two. So let's do just that.
Check out our latest analysis for Beam Global
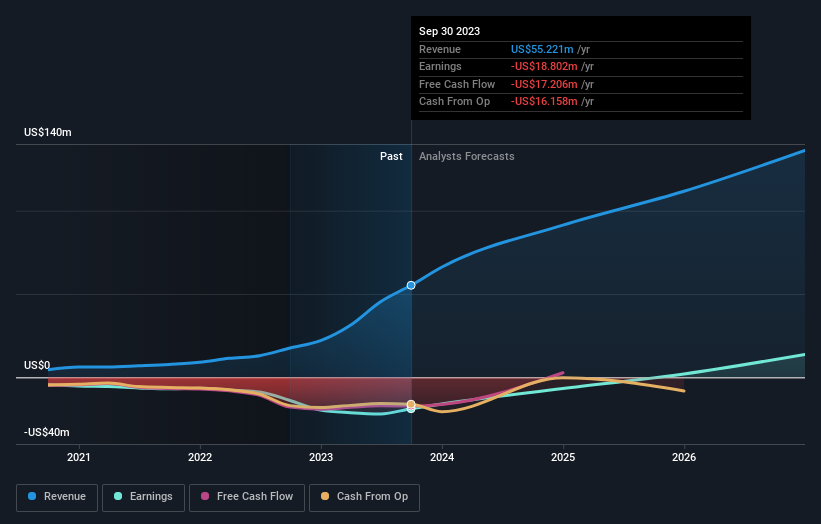
Beam Global wasn't profitable in the last twelve months, it is unlikely we'll see a strong correlation between its share price and its earnings per share (EPS). Arguably revenue is our next best option. Shareholders of unprofitable companies usually desire strong revenue growth. As you can imagine, fast revenue growth, when maintained, often leads to fast profit growth.
Over three years, Beam Global grew revenue at 81% per year. That's well above most other pre-profit companies. So on the face of it we're really surprised to see the share price down 22% a year in the same time period. You'd want to take a close look at the balance sheet, as well as the losses. Ultimately, revenue growth doesn't amount to much if the business can't scale well. If the company is low on cash, it may have to raise capital soon.
The graphic below depicts how earnings and revenue have changed over time (unveil the exact values by clicking on the image).
Balance sheet strength is crucial. It might be well worthwhile taking a look at our free report on how its financial position has changed over time.
A Different Perspective
While the broader market gained around 32% in the last year, Beam Global shareholders lost 58%. However, keep in mind that even the best stocks will sometimes underperform the market over a twelve month period. Unfortunately, last year's performance may indicate unresolved challenges, given that it was worse than the annualised loss of 5% over the last half decade. We realise that Baron Rothschild has said investors should "buy when there is blood on the streets", but we caution that investors should first be sure they are buying a high quality business. While it is well worth considering the different impacts that market conditions can have on the share price, there are other factors that are even more important. Take risks, for example - Beam Global has 3 warning signs we think you should be aware of.
But note: Beam Global may not be the best stock to buy. So take a peek at this free list of interesting companies with past earnings growth (and further growth forecast).
Please note, the market returns quoted in this article reflect the market weighted average returns of stocks that currently trade on American exchanges.
Have feedback on this article? Concerned about the content? Get in touch with us directly. Alternatively, email editorial-team (at) simplywallst.com.
This article by Simply Wall St is general in nature. We provide commentary based on historical data and analyst forecasts only using an unbiased methodology and our articles are not intended to be financial advice. It does not constitute a recommendation to buy or sell any stock, and does not take account of your objectives, or your financial situation. We aim to bring you long-term focused analysis driven by fundamental data. Note that our analysis may not factor in the latest price-sensitive company announcements or qualitative material. Simply Wall St has no position in any stocks mentioned.
