
 Yahoo Finance
 Shareholders Would Enjoy A Repeat Of Kirkland's' (NASDAQ:KIRK) Recent Growth In Returns
If we want to find a potential multi-bagger, often there are underlying trends that can provide clues. Amongst other things, we'll want to see two things; firstly, a growing return on capital employed (ROCE) and secondly, an expansion in the company's amount of capital employed. Basically this means that a company has profitable initiatives that it can continue to reinvest in, which is a trait of a compounding machine. So when we looked at the ROCE trend of Kirkland's (NASDAQ:KIRK) we really liked what we saw.
Return On Capital Employed (ROCE): What is it?
Just to clarify if you're unsure, ROCE is a metric for evaluating how much pre-tax income (in percentage terms) a company earns on the capital invested in its business. Analysts use this formula to calculate it for Kirkland's:
Return on Capital Employed = Earnings Before Interest and Tax (EBIT) ÷ (Total Assets - Current Liabilities)
0.21 = US$46m ÷ (US$345m - US$125m) (Based on the trailing twelve months to July 2021).
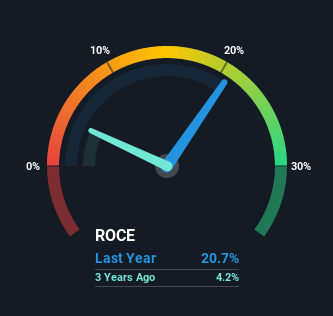
Therefore, Kirkland's has an ROCE of 21%. In absolute terms that's a very respectable return and compared to the Specialty Retail industry average of 20% it's pretty much on par.
Check out our latest analysis for Kirkland's
Above you can see how the current ROCE for Kirkland's compares to its prior returns on capital, but there's only so much you can tell from the past. If you're interested, you can view the analysts predictions in our free report on analyst forecasts for the company.
What Can We Tell From Kirkland's' ROCE Trend?
The trends we've noticed at Kirkland's are quite reassuring. The data shows that returns on capital have increased substantially over the last five years to 21%. The amount of capital employed has increased too, by 22%. This can indicate that there's plenty of opportunities to invest capital internally and at ever higher rates, a combination that's common among multi-baggers.
On a side note, we noticed that the improvement in ROCE appears to be partly fueled by an increase in current liabilities. The current liabilities has increased to 36% of total assets, so the business is now more funded by the likes of its suppliers or short-term creditors. Keep an eye out for future increases because when the ratio of current liabilities to total assets gets particularly high, this can introduce some new risks for the business.
What We Can Learn From Kirkland's' ROCE
All in all, it's terrific to see that Kirkland's is reaping the rewards from prior investments and is growing its capital base. And with a respectable 63% awarded to those who held the stock over the last five years, you could argue that these developments are starting to get the attention they deserve. Therefore, we think it would be worth your time to check if these trends are going to continue.
On a final note, we've found 2 warning signs for Kirkland's that we think you should be aware of.
If you want to search for more stocks that have been earning high returns, check out this free list of stocks with solid balance sheets that are also earning high returns on equity.
This article by Simply Wall St is general in nature. We provide commentary based on historical data and analyst forecasts only using an unbiased methodology and our articles are not intended to be financial advice. It does not constitute a recommendation to buy or sell any stock, and does not take account of your objectives, or your financial situation. We aim to bring you long-term focused analysis driven by fundamental data. Note that our analysis may not factor in the latest price-sensitive company announcements or qualitative material. Simply Wall St has no position in any stocks mentioned.
Have feedback on this article? Concerned about the content? Get in touch with us directly. Alternatively, email editorial-team (at) simplywallst.com.
