
 Yahoo Finance
 Some Shareholders Feeling Restless Over PROS Holdings, Inc.'s (NYSE:PRO) P/S Ratio
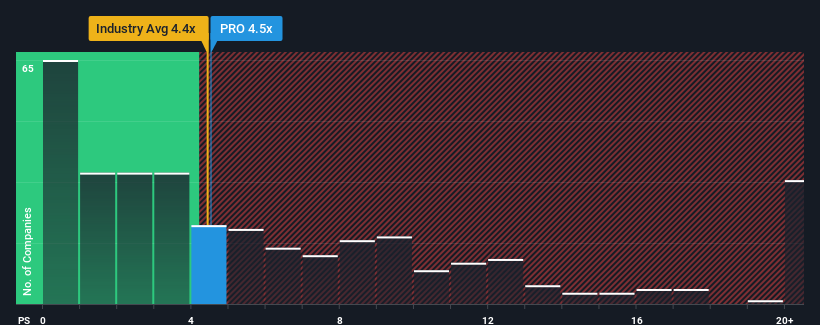
With a median price-to-sales (or "P/S") ratio of close to 4.4x in the Software industry in the United States, you could be forgiven for feeling indifferent about PROS Holdings, Inc.'s (NYSE:PRO) P/S ratio of 4.5x. However, investors might be overlooking a clear opportunity or potential setback if there is no rational basis for the P/S.
Check out our latest analysis for PROS Holdings
What Does PROS Holdings' Recent Performance Look Like?
With revenue growth that's inferior to most other companies of late, PROS Holdings has been relatively sluggish. It might be that many expect the uninspiring revenue performance to strengthen positively, which has kept the P/S ratio from falling. However, if this isn't the case, investors might get caught out paying to much for the stock.
Keen to find out how analysts think PROS Holdings' future stacks up against the industry? In that case, our free report is a great place to start.
What Are Revenue Growth Metrics Telling Us About The P/S?
PROS Holdings' P/S ratio would be typical for a company that's only expected to deliver moderate growth, and importantly, perform in line with the industry.
Retrospectively, the last year delivered a decent 9.8% gain to the company's revenues. The latest three year period has also seen a 10% overall rise in revenue, aided somewhat by its short-term performance. Accordingly, shareholders would have probably been satisfied with the medium-term rates of revenue growth.
Shifting to the future, estimates from the seven analysts covering the company suggest revenue should grow by 7.3% over the next year. With the industry predicted to deliver 12% growth, the company is positioned for a weaker revenue result.
With this in mind, we find it intriguing that PROS Holdings' P/S is closely matching its industry peers. Apparently many investors in the company are less bearish than analysts indicate and aren't willing to let go of their stock right now. These shareholders may be setting themselves up for future disappointment if the P/S falls to levels more in line with the growth outlook.
What Does PROS Holdings' P/S Mean For Investors?
Typically, we'd caution against reading too much into price-to-sales ratios when settling on investment decisions, though it can reveal plenty about what other market participants think about the company.
When you consider that PROS Holdings' revenue growth estimates are fairly muted compared to the broader industry, it's easy to see why we consider it unexpected to be trading at its current P/S ratio. At present, we aren't confident in the P/S as the predicted future revenues aren't likely to support a more positive sentiment for long. This places shareholders' investments at risk and potential investors in danger of paying an unnecessary premium.
Before you settle on your opinion, we've discovered 2 warning signs for PROS Holdings (1 is potentially serious!) that you should be aware of.
Of course, profitable companies with a history of great earnings growth are generally safer bets. So you may wish to see this free collection of other companies that have reasonable P/E ratios and have grown earnings strongly.
Have feedback on this article? Concerned about the content? Get in touch with us directly. Alternatively, email editorial-team (at) simplywallst.com.
This article by Simply Wall St is general in nature. We provide commentary based on historical data and analyst forecasts only using an unbiased methodology and our articles are not intended to be financial advice. It does not constitute a recommendation to buy or sell any stock, and does not take account of your objectives, or your financial situation. We aim to bring you long-term focused analysis driven by fundamental data. Note that our analysis may not factor in the latest price-sensitive company announcements or qualitative material. Simply Wall St has no position in any stocks mentioned.
Join A Paid User Research Session
You’ll receive a US$30 Amazon Gift card for 1 hour of your time while helping us build better investing tools for the individual investors like yourself. Sign up here
