
 Yahoo Finance
 Shareholders in Marsden Maritime Holdings (NZSE:MMH) are in the red if they invested a year ago
Investors can approximate the average market return by buying an index fund. But if you buy individual stocks, you can do both better or worse than that. Unfortunately the Marsden Maritime Holdings Limited (NZSE:MMH) share price slid 22% over twelve months. That's disappointing when you consider the market declined 2.2%. Looking at the longer term, the stock is down 21% over three years.
Now let's have a look at the company's fundamentals, and see if the long term shareholder return has matched the performance of the underlying business.
See our latest analysis for Marsden Maritime Holdings
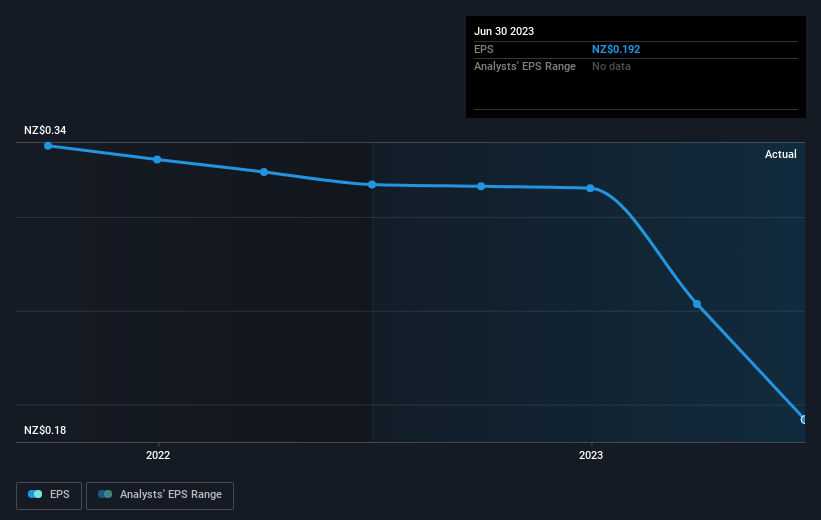
To paraphrase Benjamin Graham: Over the short term the market is a voting machine, but over the long term it's a weighing machine. One way to examine how market sentiment has changed over time is to look at the interaction between a company's share price and its earnings per share (EPS).
Unhappily, Marsden Maritime Holdings had to report a 40% decline in EPS over the last year. This fall in the EPS is significantly worse than the 22% the share price fall. So despite the weak per-share profits, some investors are probably relieved the situation wasn't more difficult.
The graphic below depicts how EPS has changed over time (unveil the exact values by clicking on the image).
This free interactive report on Marsden Maritime Holdings' earnings, revenue and cash flow is a great place to start, if you want to investigate the stock further.
What About Dividends?
When looking at investment returns, it is important to consider the difference between total shareholder return (TSR) and share price return. The TSR incorporates the value of any spin-offs or discounted capital raisings, along with any dividends, based on the assumption that the dividends are reinvested. Arguably, the TSR gives a more comprehensive picture of the return generated by a stock. In the case of Marsden Maritime Holdings, it has a TSR of -19% for the last 1 year. That exceeds its share price return that we previously mentioned. This is largely a result of its dividend payments!
A Different Perspective
Investors in Marsden Maritime Holdings had a tough year, with a total loss of 19% (including dividends), against a market gain of about 2.2%. Even the share prices of good stocks drop sometimes, but we want to see improvements in the fundamental metrics of a business, before getting too interested. Longer term investors wouldn't be so upset, since they would have made 0.8%, each year, over five years. If the fundamental data continues to indicate long term sustainable growth, the current sell-off could be an opportunity worth considering. While it is well worth considering the different impacts that market conditions can have on the share price, there are other factors that are even more important. Even so, be aware that Marsden Maritime Holdings is showing 1 warning sign in our investment analysis , you should know about...
But note: Marsden Maritime Holdings may not be the best stock to buy. So take a peek at this free list of interesting companies with past earnings growth (and further growth forecast).
Please note, the market returns quoted in this article reflect the market weighted average returns of stocks that currently trade on New Zealander exchanges.
Have feedback on this article? Concerned about the content? Get in touch with us directly. Alternatively, email editorial-team (at) simplywallst.com.
This article by Simply Wall St is general in nature. We provide commentary based on historical data and analyst forecasts only using an unbiased methodology and our articles are not intended to be financial advice. It does not constitute a recommendation to buy or sell any stock, and does not take account of your objectives, or your financial situation. We aim to bring you long-term focused analysis driven by fundamental data. Note that our analysis may not factor in the latest price-sensitive company announcements or qualitative material. Simply Wall St has no position in any stocks mentioned.
