
 Yahoo Finance
 Are Shares of Regions Financial a Buy for Value Investors?
Regions Financial's (NYSE: RF) stock has climbed 42% over the past 12 months. That's more than double the S&P 500's increase and narrowly edges out other big banks as well, with the KBW Bank Index returning 38% since this time last year.
Given this performance, it's reasonable for investors to ask: Is Regions Financial's stock still a buy for value investors?

A Regions Financial drive-thru in Indianapolis, Ind. Image source: Getty Images.
Regions Financial's price-to-book value ratio
The conventional way to measure a bank stock's valuation is to use the price-to-book value ratio. You calculate this by dividing a bank's price per share by its book value per share. This tells you how much investors think a bank is worth relative to how much the bank says its worth on its balance sheet.

If a bank has a price-to-book value ratio higher than 1.0, it's said to trade for a premium to book value. The implication is that investors think the bank will create value beyond its current net worth.
Conversely, a bank priced below its book value per share is said to trade at a discount to book value, which implies that investors think its value will erode -- from unrecognized loan losses, for instance.

Data source: YCharts.com. Chart by author.
In Regions Financial's case, its stock trades for 1.13 times its book value per share. That equates to a 13% premium to book value.
Based on its price-to-book value ratio, Regions Financial comes across as modestly priced. The median stock on the KBW Bank Index is valued at 1.41 times its book value, or well above Regions Financial.
One could thus be excused for concluding that Regions Financial's stock is still a bargain, at least compared to other bank stocks, despite the fact that it has climbed 42% in a year.

Data source: YCharts.com. Chart by author.
Regions Financial's price-to-earnings ratio
A second way to capture a bank stock's valuation is to use the price-to-earnings ratio, or P/E ratio. This is calculated by dividing a bank's share price by its earnings per share.

The P/E ratio tells you how much it costs an investor to buy $1 worth of a company's earnings. If the P/E ratio is 27, it costs $27. If the ratio is 14, the cost is $14.
There is no hard-and-fast rule for what constitutes a good P/E ratio for a bank stock. That said, you can compare a bank's P/E ratio to other stocks, both within the bank industry and outside of it. This comparability, in fact, is a key benefit of the P/E ratio over the price-to-book value ratio.
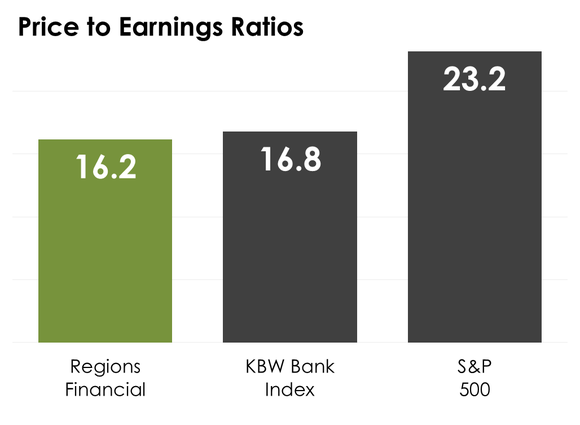
*The median was used for the KBW Bank Index and the S&P 500. Data source: YCharts.com, The Wall Street Journal. Chart by author.
In Regions Financial's case, its stock trades for 16.2 times its earnings. That compares to a median P/E ratio on the KBW Bank Index of 16.8 and a median ratio on the S&P 500 of 23.2.
By both measures, then, Regions Financial's stock seems reasonably priced, at least on a relative basis.
An important caveat
It's important to appreciate that just because Regions Financial's stock trades at a lower valuation than the typical bank stock in terms of the price-to-book value and price-to-earnings ratios doesn't mean that its share price won't fall in the future, even by a large margin, because it can.
This is especially true right now, given the multiyear bull market in equities since the financial crisis. But holding all else equal, if you're going to buy a bank stock in this environment, it wouldn't hurt to buy one that's selling at a discount to others, as Regions Financial is.
More From The Motley Fool
Why You're Smart to Buy Shopify Inc. (US) -- Despite Citron's Report
6 Years Later, 6 Charts That Show How Far Apple, Inc. Has Come Since Steve Jobs' Passing
John Maxfield has no position in any of the stocks mentioned. The Motley Fool has no position in any of the stocks mentioned. The Motley Fool has a disclosure policy.
