
 Yahoo Finance
 SINA Q1 Earnings Miss Estimates, Down Y/Y, Revenues Up
SINA Corporation SINA reported first-quarter 2019 non-GAAP earnings of 40 cents per share that missed the Zacks Consensus Estimate by 4 cents and declined 14.9% from the year-ago quarter.
Non-GAAP net revenues grew 8% year over year to $472.5 million. However, the figure missed the Zacks Consensus Estimate of $479 million.
The year-over-year increase was driven by growth in Weibo revenues and non-advertising revenues.
Sina Corporation Price, Consensus and EPS Surprise
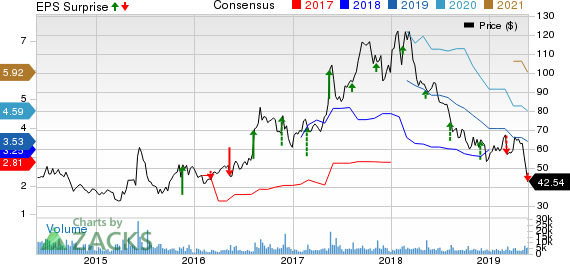
Sina Corporation price-consensus-eps-surprise-chart | Sina Corporation Quote
Quarter Details
Advertising revenues (81.7% of total revenues) increased 5.7% year over year to $388 million, primarily driven by an increase of $38.2 million in Weibo advertising and marketing revenues. However, the decline in portal advertising revenues partially offset the increase.
Non-advertising revenues (18.3% of total revenues) increased 18.2% year over year to $87.1 million. The increase was primarily attributed to revenues generated from Weibo’s live broadcasting platform and higher revenues from SINA’s fin-tech businesses.
Revenues from Weibo WB business grew 14.1% year over year to $399.2 million.
Weibo’s VAS revenues increased 23.7% to $58 million and ad and marketing revenues grew 12.6% to $341.1 million in the reported quarter. Moreover, Weibo’s online advertising revenues increased 13% year over year to $341.1 million due to the FMCG sector, which adopted the company’s marketing tools. Weibo’s SME revenues increased 5% year over year.
However, softness in the gaming sector due to “macro challenges, regulations and competition in the ad inventory supply” hurt growth.
Portal revenues declined 10% year over year to $81.8 million. Portal advertising revenues declined 26.9% year over year to $46.9 million. Decline in Small Medium Enterprise (SME) customers’ ad budget negatively impacted growth.
Portal non-ad revenue revenues increased 34% to $32.3 million. This increase was driven by growth in micro loan facilitation business.
Operating Details
SINA reported gross profit of $359.6 million, up 8.3% year over year. Gross margin of 75.7% expanded 40 basis points (bps) from the year-ago quarter. This increase was driven by a 100 bps increase in advertising platform gross margin.
Operating expenses (57.4% of total revenues) were $272.7 million, up 5.4% year over year. Sales and marketing expenses were $145.5 million, up 4.1% year over year. Product development expense was $94.1 million, reflecting an increase of 10.5%. However, general and administrative expenses fell 2.3% to $33.2 million.
Operating income in the reported quarter was $86.9 million, up 18.6% year over year.
Balance Sheet and Cash Flow
SINA exited the quarter with cash, cash equivalents and short-term investments of $2.1 billion compared with $2.3 billion in the fourth-quarter of 2018.
Cash provided by operating activities in the quarter was $93.5 million compared with $138.9 million in the prior quarter. Capital expenditure was $10 million.
Zacks Rank & Stocks to Consider
Currently, SINA has a Zacks Rank #4 (Sell).
Some better-ranked stocks in the broader computer technology sector include Verint Systems Inc. VRNT and Match Group, Inc. MTCH. Both the stocks sport a Zacks Rank #1 (Strong Buy). You can see the complete list of today’s Zacks Rank #1 stocks here.
Long-term earnings growth rate for Verint and Match is pegged at 11% and 15.2%, respectively.
Looking for Stocks with Skyrocketing Upside?
Zacks has just released a Special Report on the booming investment opportunities of legal marijuana.
Ignited by new referendums and legislation, this industry is expected to blast from an already robust $6.7 billion to $20.2 billion in 2021. Early investors stand to make a killing, but you have to be ready to act and know just where to look.
See the pot trades we're targeting>>
Want the latest recommendations from Zacks Investment Research? Today, you can download 7 Best Stocks for the Next 30 Days. Click to get this free report
Weibo Corporation (WB) : Free Stock Analysis Report
Sina Corporation (SINA) : Free Stock Analysis Report
Match Group, Inc. (MTCH) : Free Stock Analysis Report
Verint Systems Inc. (VRNT) : Free Stock Analysis Report
To read this article on Zacks.com click here.
