
 Yahoo Finance
 SRG Global Limited's (ASX:SRG) Financial Prospects Don't Look Very Positive: Could It Mean A Stock Price Drop In The Future?
Most readers would already know that SRG Global's (ASX:SRG) stock increased by 3.7% over the past three months. However, its weak financial performance indicators makes us a bit doubtful if that trend could continue. Specifically, we decided to study SRG Global's ROE in this article.
Return on Equity or ROE is a test of how effectively a company is growing its value and managing investors’ money. In other words, it is a profitability ratio which measures the rate of return on the capital provided by the company's shareholders.
Check out our latest analysis for SRG Global
How To Calculate Return On Equity?
The formula for return on equity is:
Return on Equity = Net Profit (from continuing operations) ÷ Shareholders' Equity
So, based on the above formula, the ROE for SRG Global is:
8.6% = AU$20m ÷ AU$235m (Based on the trailing twelve months to June 2022).
The 'return' is the income the business earned over the last year. One way to conceptualize this is that for each A$1 of shareholders' capital it has, the company made A$0.09 in profit.
What Has ROE Got To Do With Earnings Growth?
So far, we've learned that ROE is a measure of a company's profitability. We now need to evaluate how much profit the company reinvests or "retains" for future growth which then gives us an idea about the growth potential of the company. Assuming everything else remains unchanged, the higher the ROE and profit retention, the higher the growth rate of a company compared to companies that don't necessarily bear these characteristics.
SRG Global's Earnings Growth And 8.6% ROE
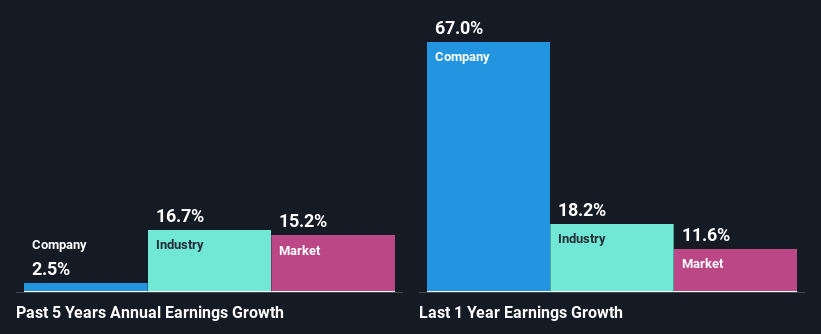
On the face of it, SRG Global's ROE is not much to talk about. Next, when compared to the average industry ROE of 14%, the company's ROE leaves us feeling even less enthusiastic. As a result, SRG Global reported a very low income growth of 2.5% over the past five years.
As a next step, we compared SRG Global's net income growth with the industry and were disappointed to see that the company's growth is lower than the industry average growth of 17% in the same period.
Earnings growth is an important metric to consider when valuing a stock. It’s important for an investor to know whether the market has priced in the company's expected earnings growth (or decline). Doing so will help them establish if the stock's future looks promising or ominous. If you're wondering about SRG Global's's valuation, check out this gauge of its price-to-earnings ratio, as compared to its industry.
Is SRG Global Making Efficient Use Of Its Profits?
With a high three-year median payout ratio of 64% (or a retention ratio of 36%), most of SRG Global's profits are being paid to shareholders. This definitely contributes to the low earnings growth seen by the company.
In addition, SRG Global has been paying dividends over a period of four years suggesting that keeping up dividend payments is way more important to the management even if it comes at the cost of business growth. Our latest analyst data shows that the future payout ratio of the company over the next three years is expected to be approximately 59%. However, SRG Global's ROE is predicted to rise to 13% despite there being no anticipated change in its payout ratio.
Summary
On the whole, SRG Global's performance is quite a big let-down. As a result of its low ROE and lack of much reinvestment into the business, the company has seen a disappointing earnings growth rate. That being so, the latest analyst forecasts show that the company will continue to see an expansion in its earnings. To know more about the company's future earnings growth forecasts take a look at this free report on analyst forecasts for the company to find out more.
Have feedback on this article? Concerned about the content? Get in touch with us directly. Alternatively, email editorial-team (at) simplywallst.com.
This article by Simply Wall St is general in nature. We provide commentary based on historical data and analyst forecasts only using an unbiased methodology and our articles are not intended to be financial advice. It does not constitute a recommendation to buy or sell any stock, and does not take account of your objectives, or your financial situation. We aim to bring you long-term focused analysis driven by fundamental data. Note that our analysis may not factor in the latest price-sensitive company announcements or qualitative material. Simply Wall St has no position in any stocks mentioned.
Join A Paid User Research Session
You’ll receive a US$30 Amazon Gift card for 1 hour of your time while helping us build better investing tools for the individual investors like yourself. Sign up here
