
 Yahoo Finance
 Stelrad Group (LON:SRAD) Is Experiencing Growth In Returns On Capital
If we want to find a stock that could multiply over the long term, what are the underlying trends we should look for? Typically, we'll want to notice a trend of growing return on capital employed (ROCE) and alongside that, an expanding base of capital employed. Ultimately, this demonstrates that it's a business that is reinvesting profits at increasing rates of return. So on that note, Stelrad Group (LON:SRAD) looks quite promising in regards to its trends of return on capital.
What Is Return On Capital Employed (ROCE)?
If you haven't worked with ROCE before, it measures the 'return' (pre-tax profit) a company generates from capital employed in its business. To calculate this metric for Stelrad Group, this is the formula:
Return on Capital Employed = Earnings Before Interest and Tax (EBIT) ÷ (Total Assets - Current Liabilities)
0.16 = UK£25m ÷ (UK£248m - UK£93m) (Based on the trailing twelve months to June 2023).
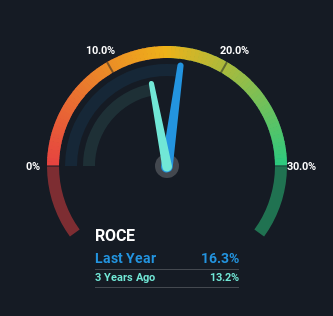
Thus, Stelrad Group has an ROCE of 16%. In absolute terms, that's a satisfactory return, but compared to the Consumer Durables industry average of 9.7% it's much better.
View our latest analysis for Stelrad Group
In the above chart we have measured Stelrad Group's prior ROCE against its prior performance, but the future is arguably more important. If you'd like, you can check out the forecasts from the analysts covering Stelrad Group for free.
So How Is Stelrad Group's ROCE Trending?
Stelrad Group is displaying some positive trends. Over the last five years, returns on capital employed have risen substantially to 16%. The amount of capital employed has increased too, by 86%. This can indicate that there's plenty of opportunities to invest capital internally and at ever higher rates, a combination that's common among multi-baggers.
In Conclusion...
A company that is growing its returns on capital and can consistently reinvest in itself is a highly sought after trait, and that's what Stelrad Group has. Since the total return from the stock has been almost flat over the last year, there might be an opportunity here if the valuation looks good. So researching this company further and determining whether or not these trends will continue seems justified.
On a separate note, we've found 2 warning signs for Stelrad Group you'll probably want to know about.
While Stelrad Group isn't earning the highest return, check out this free list of companies that are earning high returns on equity with solid balance sheets.
Have feedback on this article? Concerned about the content? Get in touch with us directly. Alternatively, email editorial-team (at) simplywallst.com.
This article by Simply Wall St is general in nature. We provide commentary based on historical data and analyst forecasts only using an unbiased methodology and our articles are not intended to be financial advice. It does not constitute a recommendation to buy or sell any stock, and does not take account of your objectives, or your financial situation. We aim to bring you long-term focused analysis driven by fundamental data. Note that our analysis may not factor in the latest price-sensitive company announcements or qualitative material. Simply Wall St has no position in any stocks mentioned.
