
 Yahoo Finance
 It's A Story Of Risk Vs Reward With SRG Global Limited (ASX:SRG)
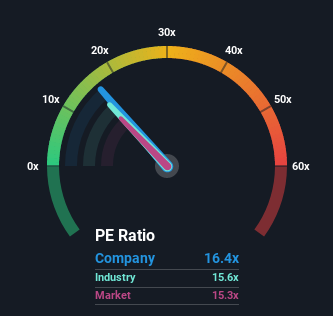
It's not a stretch to say that SRG Global Limited's (ASX:SRG) price-to-earnings (or "P/E") ratio of 16.4x right now seems quite "middle-of-the-road" compared to the market in Australia, where the median P/E ratio is around 15x. While this might not raise any eyebrows, if the P/E ratio is not justified investors could be missing out on a potential opportunity or ignoring looming disappointment.
With earnings growth that's superior to most other companies of late, SRG Global has been doing relatively well. One possibility is that the P/E is moderate because investors think this strong earnings performance might be about to tail off. If not, then existing shareholders have reason to be feeling optimistic about the future direction of the share price.
View our latest analysis for SRG Global
If you'd like to see what analysts are forecasting going forward, you should check out our free report on SRG Global.
What Are Growth Metrics Telling Us About The P/E?
SRG Global's P/E ratio would be typical for a company that's only expected to deliver moderate growth, and importantly, perform in line with the market.
Taking a look back first, we see that the company grew earnings per share by an impressive 67% last year. The strong recent performance means it was also able to grow EPS by 93% in total over the last three years. Accordingly, shareholders would have probably welcomed those medium-term rates of earnings growth.
Turning to the outlook, the next three years should generate growth of 20% per year as estimated by the one analyst watching the company. With the market only predicted to deliver 13% each year, the company is positioned for a stronger earnings result.
In light of this, it's curious that SRG Global's P/E sits in line with the majority of other companies. Apparently some shareholders are skeptical of the forecasts and have been accepting lower selling prices.
The Key Takeaway
Generally, our preference is to limit the use of the price-to-earnings ratio to establishing what the market thinks about the overall health of a company.
Our examination of SRG Global's analyst forecasts revealed that its superior earnings outlook isn't contributing to its P/E as much as we would have predicted. There could be some unobserved threats to earnings preventing the P/E ratio from matching the positive outlook. At least the risk of a price drop looks to be subdued, but investors seem to think future earnings could see some volatility.
Before you settle on your opinion, we've discovered 1 warning sign for SRG Global that you should be aware of.
Of course, you might also be able to find a better stock than SRG Global. So you may wish to see this free collection of other companies that sit on P/E's below 20x and have grown earnings strongly.
Have feedback on this article? Concerned about the content? Get in touch with us directly. Alternatively, email editorial-team (at) simplywallst.com.
This article by Simply Wall St is general in nature. We provide commentary based on historical data and analyst forecasts only using an unbiased methodology and our articles are not intended to be financial advice. It does not constitute a recommendation to buy or sell any stock, and does not take account of your objectives, or your financial situation. We aim to bring you long-term focused analysis driven by fundamental data. Note that our analysis may not factor in the latest price-sensitive company announcements or qualitative material. Simply Wall St has no position in any stocks mentioned.
Join A Paid User Research Session
You’ll receive a US$30 Amazon Gift card for 1 hour of your time while helping us build better investing tools for the individual investors like yourself. Sign up here
