
 Yahoo Finance
 Strong week for Barfresh Food Group (NASDAQ:BRFH) shareholders doesn't alleviate pain of five-year loss
This week we saw the Barfresh Food Group, Inc. (NASDAQ:BRFH) share price climb by 14%. But if you look at the last five years the returns have not been good. In fact, the share price is down 40%, which falls well short of the return you could get by buying an index fund.
On a more encouraging note the company has added US$9.3m to its market cap in just the last 7 days, so let's see if we can determine what's driven the five-year loss for shareholders.
View our latest analysis for Barfresh Food Group
Because Barfresh Food Group made a loss in the last twelve months, we think the market is probably more focussed on revenue and revenue growth, at least for now. Generally speaking, companies without profits are expected to grow revenue every year, and at a good clip. As you can imagine, fast revenue growth, when maintained, often leads to fast profit growth.
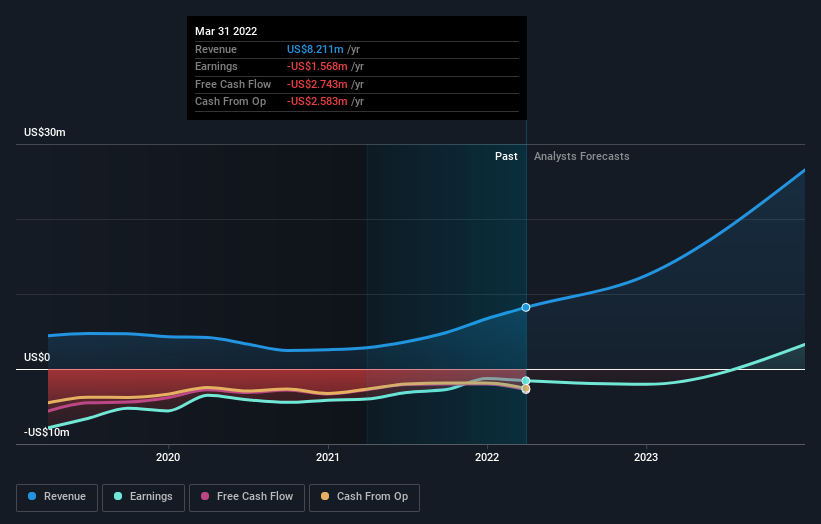
Over five years, Barfresh Food Group grew its revenue at 20% per year. That's better than most loss-making companies. The share price drop of 7% per year over five years would be considered let down. So you might argue the Barfresh Food Group should get more credit for its rather impressive revenue growth over the period. So now is probably an apt time to look closer at the stock, if you think it has potential.
You can see how earnings and revenue have changed over time in the image below (click on the chart to see the exact values).
If you are thinking of buying or selling Barfresh Food Group stock, you should check out this FREE detailed report on its balance sheet.
A Different Perspective
The total return of 18% received by Barfresh Food Group shareholders over the last year isn't far from the market return of -20%. Unfortunately, last year's performance is a deterioration of an already poor long term track record, given the loss of 7% per year over the last five years. Weak performance over the long term usually destroys market confidence in a stock, but bargain hunters may want to take a closer look for signs of a turnaround. I find it very interesting to look at share price over the long term as a proxy for business performance. But to truly gain insight, we need to consider other information, too. For instance, we've identified 4 warning signs for Barfresh Food Group that you should be aware of.
If you like to buy stocks alongside management, then you might just love this free list of companies. (Hint: insiders have been buying them).
Please note, the market returns quoted in this article reflect the market weighted average returns of stocks that currently trade on US exchanges.
Have feedback on this article? Concerned about the content? Get in touch with us directly. Alternatively, email editorial-team (at) simplywallst.com.
This article by Simply Wall St is general in nature. We provide commentary based on historical data and analyst forecasts only using an unbiased methodology and our articles are not intended to be financial advice. It does not constitute a recommendation to buy or sell any stock, and does not take account of your objectives, or your financial situation. We aim to bring you long-term focused analysis driven by fundamental data. Note that our analysis may not factor in the latest price-sensitive company announcements or qualitative material. Simply Wall St has no position in any stocks mentioned.
