
 Yahoo Finance
 Summerset Group Holdings (NZSE:SUM) Shareholders Booked A 83% Gain In The Last Five Years

Want to participate in a research study? Help shape the future of investing tools and earn a $60 gift card!
Generally speaking the aim of active stock picking is to find companies that provide returns that are superior to the market average. Buying under-rated businesses is one path to excess returns. To wit, the Summerset Group Holdings share price has climbed 83% in five years, easily topping the market return of 45% (ignoring dividends).
View our latest analysis for Summerset Group Holdings
While markets are a powerful pricing mechanism, share prices reflect investor sentiment, not just underlying business performance. One flawed but reasonable way to assess how sentiment around a company has changed is to compare the earnings per share (EPS) with the share price.
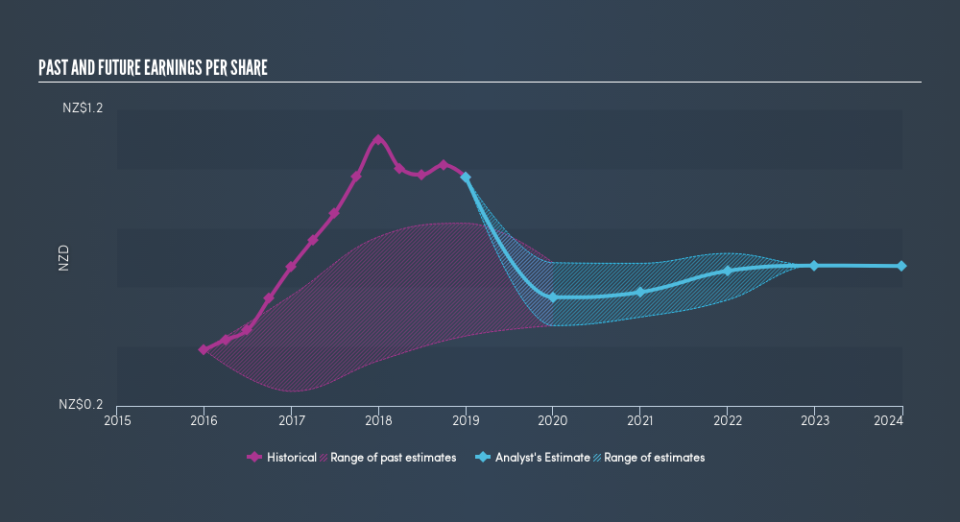
Over half a decade, Summerset Group Holdings managed to grow its earnings per share at 43% a year. This EPS growth is higher than the 13% average annual increase in the share price. Therefore, it seems the market has become relatively pessimistic about the company. The reasonably low P/E ratio of 6.67 also suggests market apprehension.
The image below shows how EPS has tracked over time (if you click on the image you can see greater detail).
We know that Summerset Group Holdings has improved its bottom line over the last three years, but what does the future have in store? This free interactive report on Summerset Group Holdings's balance sheet strength is a great place to start, if you want to investigate the stock further.
What About Dividends?
As well as measuring the share price return, investors should also consider the total shareholder return (TSR). Whereas the share price return only reflects the change in the share price, the TSR includes the value of dividends (assuming they were reinvested) and the benefit of any discounted capital raising or spin-off. So for companies that pay a generous dividend, the TSR is often a lot higher than the share price return. In the case of Summerset Group Holdings, it has a TSR of 98% for the last 5 years. That exceeds its share price return that we previously mentioned. And there's no prize for guessing that the dividend payments largely explain the divergence!
A Different Perspective
While the broader market gained around 13% in the last year, Summerset Group Holdings shareholders lost 4.8% (even including dividends). Even the share prices of good stocks drop sometimes, but we want to see improvements in the fundamental metrics of a business, before getting too interested. Longer term investors wouldn't be so upset, since they would have made 15%, each year, over five years. If the fundamental data continues to indicate long term sustainable growth, the current sell-off could be an opportunity worth considering. Before spending more time on Summerset Group Holdings it might be wise to click here to see if insiders have been buying or selling shares.
We will like Summerset Group Holdings better if we see some big insider buys. While we wait, check out this free list of growing companies with considerable, recent, insider buying.
Please note, the market returns quoted in this article reflect the market weighted average returns of stocks that currently trade on NZ exchanges.
We aim to bring you long-term focused research analysis driven by fundamental data. Note that our analysis may not factor in the latest price-sensitive company announcements or qualitative material.
If you spot an error that warrants correction, please contact the editor at editorial-team@simplywallst.com. This article by Simply Wall St is general in nature. It does not constitute a recommendation to buy or sell any stock, and does not take account of your objectives, or your financial situation. Simply Wall St has no position in the stocks mentioned. Thank you for reading.
