
 Yahoo Finance
 Sun Hung Kai Properties Ltd's Dividend Analysis
Assessing the Upcoming Dividend and Historical Performance
Sun Hung Kai Properties Ltd (SUHJY) recently announced a dividend of $0.12 per share, payable on 2024-03-27, with the ex-dividend date set for 2024-03-12. As investors look forward to this upcoming payment, the spotlight also shines on the company's dividend history, yield, and growth rates. Using the data from GuruFocus, let's look into Sun Hung Kai Properties Ltd's dividend performance and assess its sustainability.
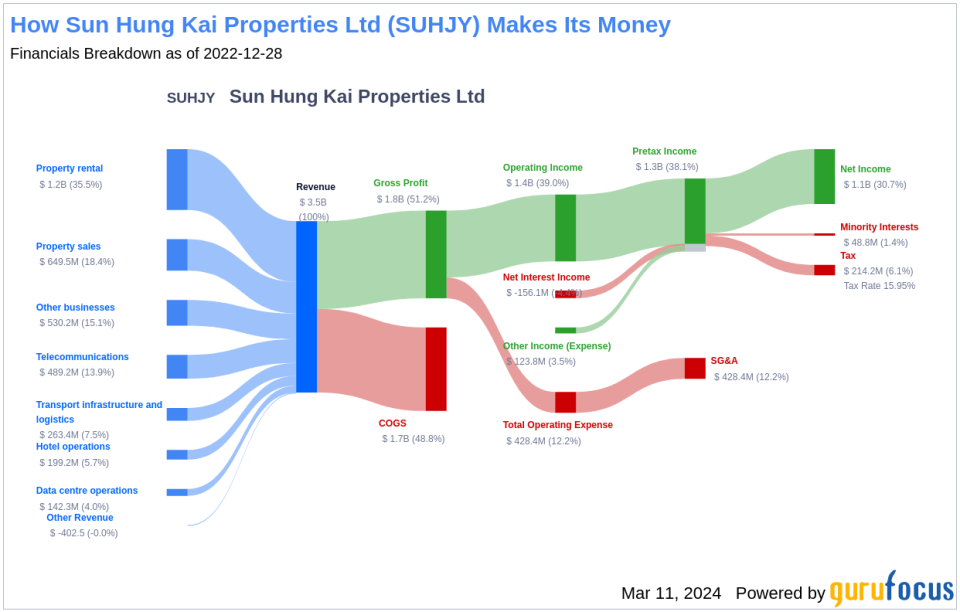
What Does Sun Hung Kai Properties Ltd Do?
This Powerful Chart Made Peter Lynch 29% A Year For 13 Years
How to calculate the intrinsic value of a stock?
Sun Hung Kai Properties is a diversified real estate developer in Hong Kong with a core focus on the residential, retail, and office real estate segment. Most of its business is based in Hong Kong where it is a leading private housing developer and holds a portfolio of high-quality retail and office assets for rental income. The company also invests in other listed entities, including telecommunication company, SmarTone, and data center provider, SUNeVision. The Kwok family is the controlling shareholder, with a stake of more than 40%.
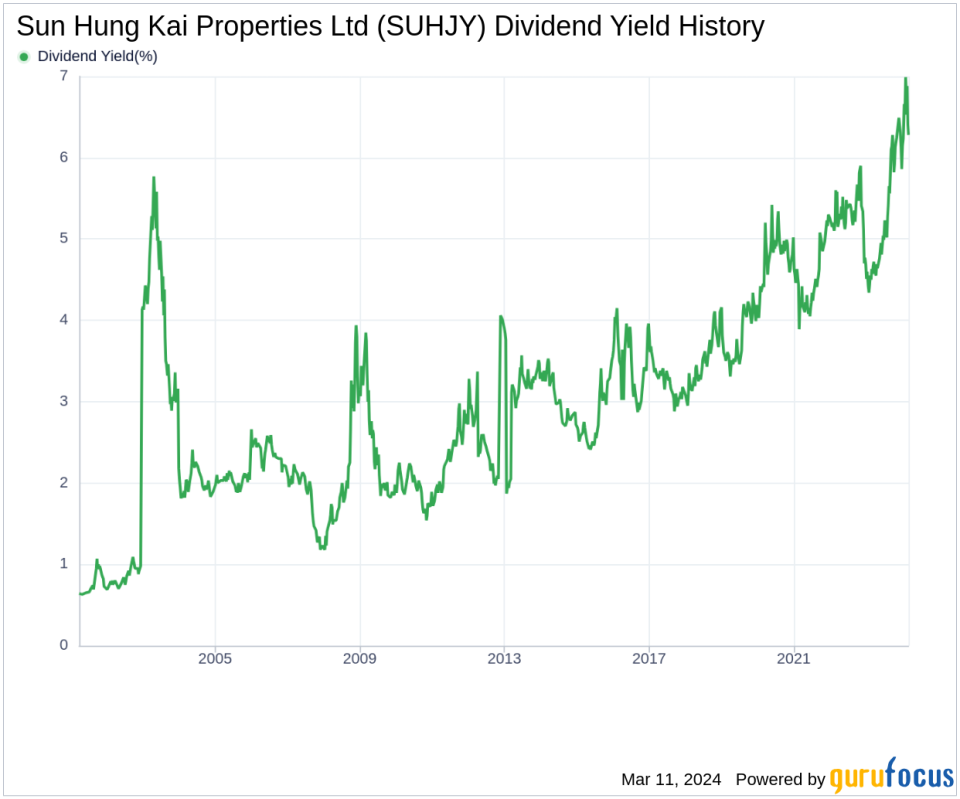
A Glimpse at Sun Hung Kai Properties Ltd's Dividend History
Sun Hung Kai Properties Ltd has maintained a consistent dividend payment record since 2001. Dividends are currently distributed on a bi-annual basis. Below is a chart showing annual Dividends Per Share for tracking historical trends.
Breaking Down Sun Hung Kai Properties Ltd's Dividend Yield and Growth
As of today, Sun Hung Kai Properties Ltd currently has a 12-month trailing dividend yield of 6.36% and a 12-month forward dividend yield of 5.98%. This suggests an expectation of decreased dividend payments over the next 12 months. Extended to a five-year horizon, this rate increased to 2.80% per year. And over the past decade, Sun Hung Kai Properties Ltd's annual dividends per share growth rate stands at 5.20%.
Based on Sun Hung Kai Properties Ltd's dividend yield and five-year growth rate, the 5-year yield on cost of Sun Hung Kai Properties Ltd stock as of today is approximately 7.30%.
The Sustainability Question: Payout Ratio and Profitability
To assess the sustainability of the dividend, one needs to evaluate the company's payout ratio. The dividend payout ratio provides insights into the portion of earnings the company distributes as dividends. A lower ratio suggests that the company retains a significant part of its earnings, thereby ensuring the availability of funds for future growth and unexpected downturns. As of 2023-12-31, Sun Hung Kai Properties Ltd's dividend payout ratio is 0.61.
Sun Hung Kai Properties Ltd's profitability rank, offers an understanding of the company's earnings prowess relative to its peers. GuruFocus ranks Sun Hung Kai Properties Ltd's profitability 7 out of 10 as of 2023-12-31, suggesting good profitability prospects. The company has reported positive net income for each year over the past decade, further solidifying its high profitability.
Growth Metrics: The Future Outlook
To ensure the sustainability of dividends, a company must have robust growth metrics. Sun Hung Kai Properties Ltd's growth rank of 7 out of 10 suggests that the company's growth trajectory is good relative to its competitors.
Revenue is the lifeblood of any company, and Sun Hung Kai Properties Ltd's revenue per share, combined with the 3-year revenue growth rate, indicates a strong revenue model. Sun Hung Kai Properties Ltd's revenue has increased by approximately -4.90% per year on average, a rate that underperforms approximately 67.74% of global competitors.
The company's 3-year EPS growth rate showcases its capability to grow its earnings, a critical component for sustaining dividends in the long run. During the past three years, Sun Hung Kai Properties Ltd's earnings increased by approximately -6.70% per year on average, a rate that underperforms approximately 60.78% of global competitors.
Lastly, the company's 5-year EBITDA growth rate of -4.30%, which underperforms approximately 65.16% of global competitors, indicates some challenges in profitability growth.
Next Steps
In conclusion, while Sun Hung Kai Properties Ltd has a history of consistent dividend payments and a respectable yield, the potential decrease in dividend payments and the underperformance in growth metrics raise questions about the long-term sustainability of its dividends. The dividend payout ratio and profitability rank indicate a level of resilience, but value investors should weigh these factors carefully against the company's growth prospects. Is Sun Hung Kai Properties Ltd's dividend yield enticing enough to compensate for its growth challenges? This is a question investors must consider in their analysis.
GuruFocus Premium users can screen for high-dividend yield stocks using the High Dividend Yield Screener.
This article, generated by GuruFocus, is designed to provide general insights and is not tailored financial advice. Our commentary is rooted in historical data and analyst projections, utilizing an impartial methodology, and is not intended to serve as specific investment guidance. It does not formulate a recommendation to purchase or divest any stock and does not consider individual investment objectives or financial circumstances. Our objective is to deliver long-term, fundamental data-driven analysis. Be aware that our analysis might not incorporate the most recent, price-sensitive company announcements or qualitative information. GuruFocus holds no position in the stocks mentioned herein.
This article first appeared on GuruFocus.
