
 Yahoo Finance
 Swelling losses haven't held back gains for Varonis Systems (NASDAQ:VRNS) shareholders since they're up 144% over 5 years
The last three months have been tough on Varonis Systems, Inc. (NASDAQ:VRNS) shareholders, who have seen the share price decline a rather worrying 36%. But that doesn't change the fact that the returns over the last five years have been very strong. Indeed, the share price is up an impressive 144% in that time. Generally speaking the long term returns will give you a better idea of business quality than short periods can. Only time will tell if there is still too much optimism currently reflected in the share price. Unfortunately not all shareholders will have held it for the long term, so spare a thought for those caught in the 48% decline over the last twelve months.
Since the long term performance has been good but there's been a recent pullback of 5.8%, let's check if the fundamentals match the share price.
View our latest analysis for Varonis Systems
Varonis Systems isn't currently profitable, so most analysts would look to revenue growth to get an idea of how fast the underlying business is growing. Shareholders of unprofitable companies usually expect strong revenue growth. Some companies are willing to postpone profitability to grow revenue faster, but in that case one does expect good top-line growth.
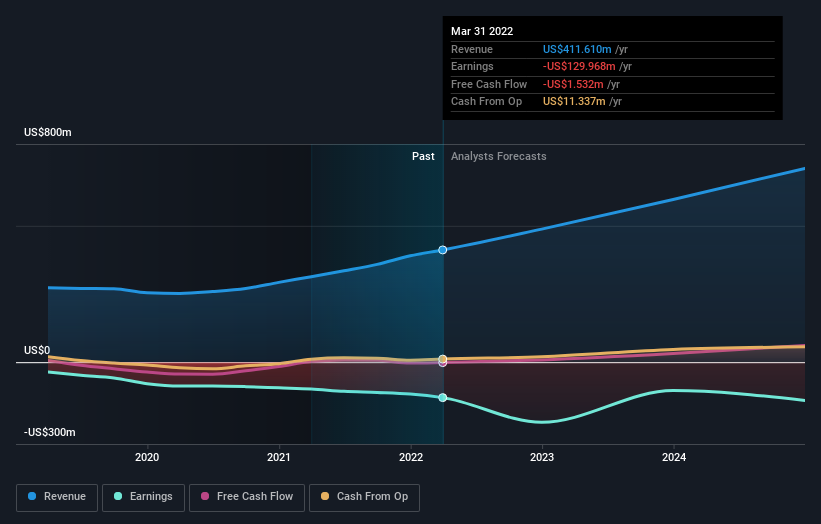
For the last half decade, Varonis Systems can boast revenue growth at a rate of 14% per year. That's a pretty good long term growth rate. We'd argue this growth has been reflected in the share price which has climbed at a rate of 20% per year over in that time. Given that the business has made good progress on the top line, it would be worth taking a look at the growth trend. When a growth trend accelerates, be it in revenue or earnings, it can indicate an inflection point for the business, which is can often be an opportunity for investors.
You can see how earnings and revenue have changed over time in the image below (click on the chart to see the exact values).
Varonis Systems is well known by investors, and plenty of clever analysts have tried to predict the future profit levels. If you are thinking of buying or selling Varonis Systems stock, you should check out this free report showing analyst consensus estimates for future profits.
A Different Perspective
We regret to report that Varonis Systems shareholders are down 48% for the year. Unfortunately, that's worse than the broader market decline of 20%. However, it could simply be that the share price has been impacted by broader market jitters. It might be worth keeping an eye on the fundamentals, in case there's a good opportunity. On the bright side, long term shareholders have made money, with a gain of 20% per year over half a decade. If the fundamental data continues to indicate long term sustainable growth, the current sell-off could be an opportunity worth considering. It's always interesting to track share price performance over the longer term. But to understand Varonis Systems better, we need to consider many other factors. Case in point: We've spotted 4 warning signs for Varonis Systems you should be aware of.
If you like to buy stocks alongside management, then you might just love this free list of companies. (Hint: insiders have been buying them).
Please note, the market returns quoted in this article reflect the market weighted average returns of stocks that currently trade on US exchanges.
Have feedback on this article? Concerned about the content? Get in touch with us directly. Alternatively, email editorial-team (at) simplywallst.com.
This article by Simply Wall St is general in nature. We provide commentary based on historical data and analyst forecasts only using an unbiased methodology and our articles are not intended to be financial advice. It does not constitute a recommendation to buy or sell any stock, and does not take account of your objectives, or your financial situation. We aim to bring you long-term focused analysis driven by fundamental data. Note that our analysis may not factor in the latest price-sensitive company announcements or qualitative material. Simply Wall St has no position in any stocks mentioned.
