
 Yahoo Finance
 T-Mobile US' (NASDAQ:TMUS) investors will be pleased with their solid 150% return over the last five years
The most you can lose on any stock (assuming you don't use leverage) is 100% of your money. But when you pick a company that is really flourishing, you can make more than 100%. Long term T-Mobile US, Inc. (NASDAQ:TMUS) shareholders would be well aware of this, since the stock is up 150% in five years. In the last week shares have slid back 1.2%.
Let's take a look at the underlying fundamentals over the longer term, and see if they've been consistent with shareholders returns.
See our latest analysis for T-Mobile US
While the efficient markets hypothesis continues to be taught by some, it has been proven that markets are over-reactive dynamic systems, and investors are not always rational. One way to examine how market sentiment has changed over time is to look at the interaction between a company's share price and its earnings per share (EPS).
T-Mobile US' earnings per share are down 17% per year, despite strong share price performance over five years.
This means it's unlikely the market is judging the company based on earnings growth. Since the change in EPS doesn't seem to correlate with the change in share price, it's worth taking a look at other metrics.
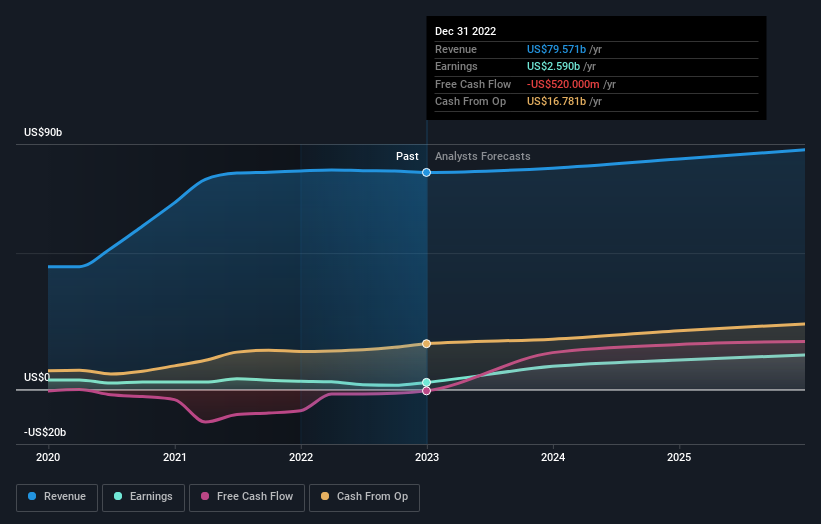
On the other hand, T-Mobile US' revenue is growing nicely, at a compound rate of 18% over the last five years. In that case, the company may be sacrificing current earnings per share to drive growth.
The company's revenue and earnings (over time) are depicted in the image below (click to see the exact numbers).
T-Mobile US is well known by investors, and plenty of clever analysts have tried to predict the future profit levels. So it makes a lot of sense to check out what analysts think T-Mobile US will earn in the future (free analyst consensus estimates)
A Different Perspective
We're pleased to report that T-Mobile US shareholders have received a total shareholder return of 19% over one year. However, the TSR over five years, coming in at 20% per year, is even more impressive. I find it very interesting to look at share price over the long term as a proxy for business performance. But to truly gain insight, we need to consider other information, too. To that end, you should be aware of the 2 warning signs we've spotted with T-Mobile US .
Of course, you might find a fantastic investment by looking elsewhere. So take a peek at this free list of companies we expect will grow earnings.
Please note, the market returns quoted in this article reflect the market weighted average returns of stocks that currently trade on US exchanges.
Have feedback on this article? Concerned about the content? Get in touch with us directly. Alternatively, email editorial-team (at) simplywallst.com.
This article by Simply Wall St is general in nature. We provide commentary based on historical data and analyst forecasts only using an unbiased methodology and our articles are not intended to be financial advice. It does not constitute a recommendation to buy or sell any stock, and does not take account of your objectives, or your financial situation. We aim to bring you long-term focused analysis driven by fundamental data. Note that our analysis may not factor in the latest price-sensitive company announcements or qualitative material. Simply Wall St has no position in any stocks mentioned.
Join A Paid User Research Session
You’ll receive a US$30 Amazon Gift card for 1 hour of your time while helping us build better investing tools for the individual investors like yourself. Sign up here
