
 Yahoo Finance
 TE Connectivity's (NYSE:TEL) five-year total shareholder returns outpace the underlying earnings growth
TE Connectivity Ltd. (NYSE:TEL) shareholders might be concerned after seeing the share price drop 16% in the last quarter. But at least the stock is up over the last five years. However we are not very impressed because the share price is only up 40%, less than the market return of 66%.
While this past week has detracted from the company's five-year return, let's look at the recent trends of the underlying business and see if the gains have been in alignment.
See our latest analysis for TE Connectivity
In his essay The Superinvestors of Graham-and-Doddsville Warren Buffett described how share prices do not always rationally reflect the value of a business. One way to examine how market sentiment has changed over time is to look at the interaction between a company's share price and its earnings per share (EPS).
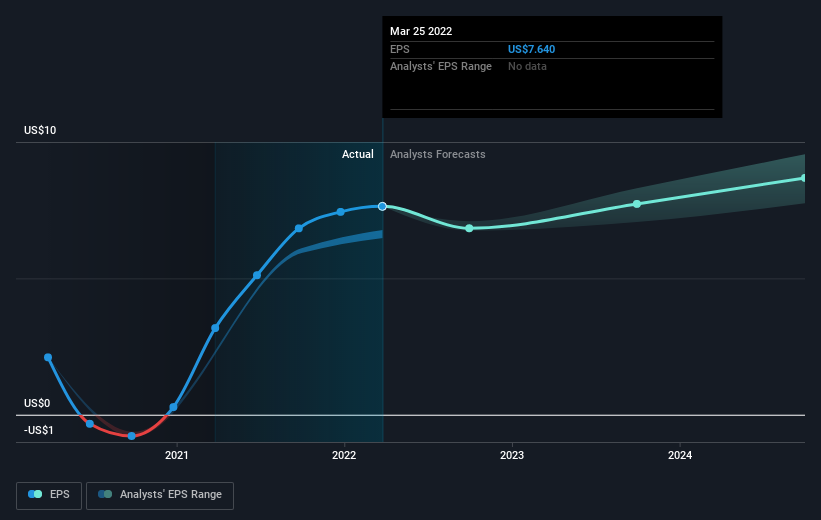
Over half a decade, TE Connectivity managed to grow its earnings per share at 6.3% a year. This EPS growth is reasonably close to the 7% average annual increase in the share price. That suggests that the market sentiment around the company hasn't changed much over that time. Rather, the share price has approximately tracked EPS growth.
You can see below how EPS has changed over time (discover the exact values by clicking on the image).
We know that TE Connectivity has improved its bottom line lately, but is it going to grow revenue? Check if analysts think TE Connectivity will grow revenue in the future.
What About Dividends?
As well as measuring the share price return, investors should also consider the total shareholder return (TSR). Whereas the share price return only reflects the change in the share price, the TSR includes the value of dividends (assuming they were reinvested) and the benefit of any discounted capital raising or spin-off. It's fair to say that the TSR gives a more complete picture for stocks that pay a dividend. We note that for TE Connectivity the TSR over the last 5 years was 54%, which is better than the share price return mentioned above. And there's no prize for guessing that the dividend payments largely explain the divergence!
A Different Perspective
TE Connectivity shareholders are down 19% over twelve months (even including dividends), which isn't far from the market return of -20%. Longer term investors wouldn't be so upset, since they would have made 9%, each year, over five years. If the fundamental data remains strong, and the share price is simply down on sentiment, then this could be an opportunity worth investigating. I find it very interesting to look at share price over the long term as a proxy for business performance. But to truly gain insight, we need to consider other information, too. Even so, be aware that TE Connectivity is showing 1 warning sign in our investment analysis , you should know about...
Of course, you might find a fantastic investment by looking elsewhere. So take a peek at this free list of companies we expect will grow earnings.
Please note, the market returns quoted in this article reflect the market weighted average returns of stocks that currently trade on US exchanges.
Have feedback on this article? Concerned about the content? Get in touch with us directly. Alternatively, email editorial-team (at) simplywallst.com.
This article by Simply Wall St is general in nature. We provide commentary based on historical data and analyst forecasts only using an unbiased methodology and our articles are not intended to be financial advice. It does not constitute a recommendation to buy or sell any stock, and does not take account of your objectives, or your financial situation. We aim to bring you long-term focused analysis driven by fundamental data. Note that our analysis may not factor in the latest price-sensitive company announcements or qualitative material. Simply Wall St has no position in any stocks mentioned.
